/GE%20Aerospace%20turbine%20engine-by%20hapabapa%20via%20iStock.jpg)
On paper, GE Aerospace (GE) seemingly did everything right. For the quarter ended March 2026, the aerospace specialist reported sales of $11.61 billion, representing a year-over-year lift of 29%. This figure also beat the consensus estimate of $10.64 billion. As well, earnings per share hit $1.86, exceeding the $1.61 target and rising sharply above the year-ago period’s EPS of $1.49.
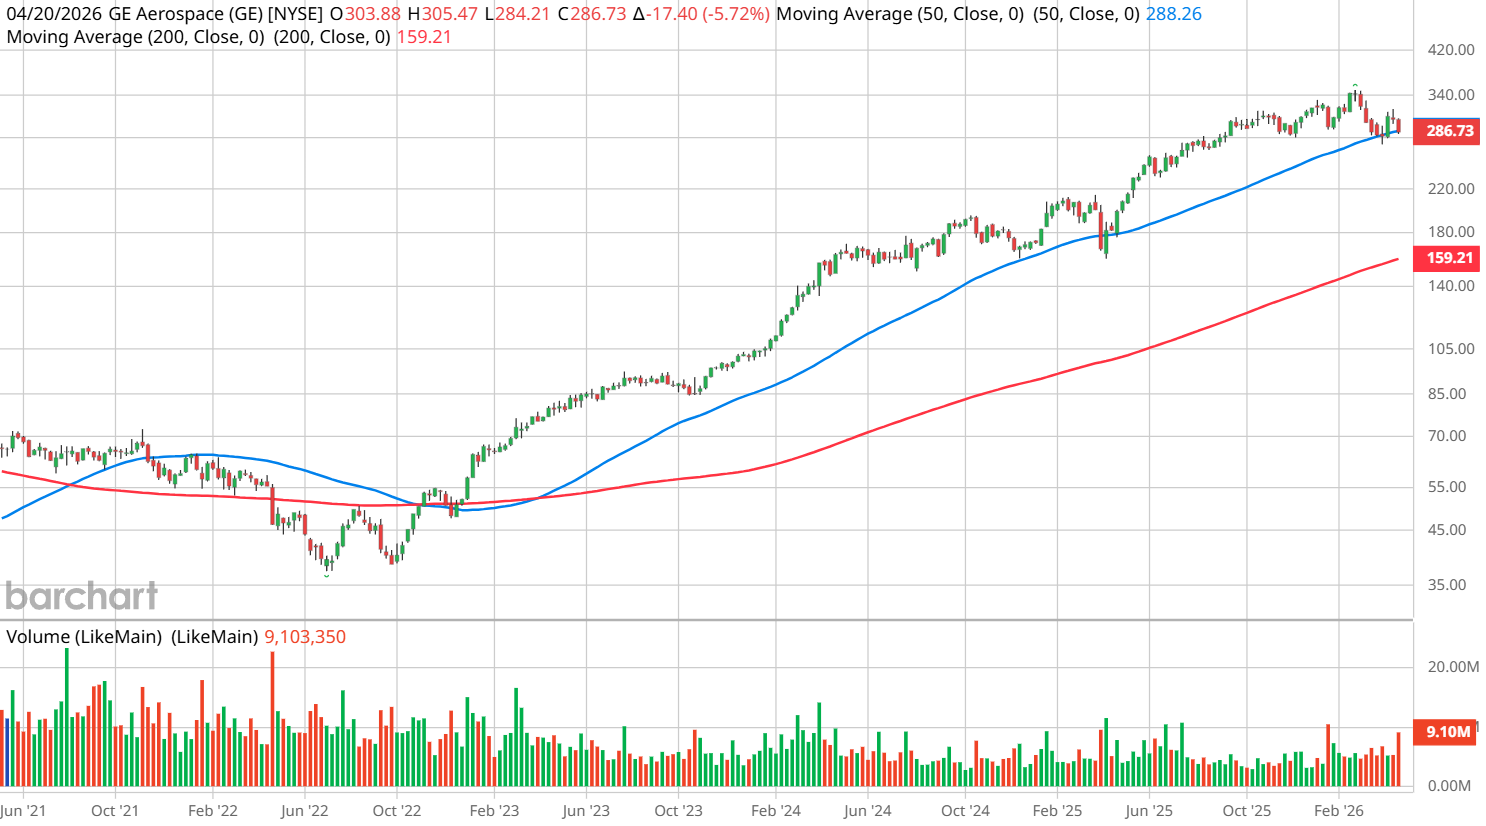
Still, that wasn’t enough to please investors, with GE stock dropping roughly 6% following the disclosure. It raises the obvious question: what the heck happened?
Primarily, the market appeared disappointed that full-year guidance was left unchanged, which isn’t all that surprising. Amid sustained geopolitical uncertainty over the Iran conflict and its economic impact, investors have grown concerned about margin pressure. As well, near-term headwinds — such as rising oil prices and slower air travel growth — could compound if the aforementioned crisis isn’t resolved soon.
Nevertheless, the first-quarter print provided a promising impression for GE stock should the geopolitical end cooperate. For example, total orders skyrocketed 87% on a year-over-year basis to $23 billion. Notably, Commercial Engines & Services (CES) orders popped 93%, while the Defense & Propulsion Technologies (DPT) unit saw a gain of 67%, sparked by record demand from the defense industry.
It should also be noted that GE Aerospace is sitting on a backlog totaling over $210 billion. No, investors shouldn’t ignore the hefty challenges facing the company. However, the concerns hanging over GE stock largely stem from external factors that no business can control. If we set aside these obstacles, we’re left with the conclusion that execution is top notch.
In addition, GE’s razor and blade model is working out beautifully. Along with demand for the engines themselves, management stated that spare parts demand is also on the uptrend. Yes, this matter is a huge headache for airliners — on the other end, GE parts are being sold at premium pricing.
GE Stock Flashes an Enticing Signal
While the above narrative is an intriguing one for GE stock, it’s also well-worn. Basically, if I’m telling you about it, it’s almost a sure bet that the information has been digested and priced in. That’s because in the information stream, I’m a downstream source. On the upstream, GE disclosed its financial information, while the major news outlets have aggregated the meat for their audience.
Other leading financial publications have also broadcasted their opinions on GE stock — and so I’m just getting this data to you after it has gone through many layers. I’m as bottom of downstream as you can get. By that logic, the above narrative should be priced in.
What might not be priced in, though, is the underlying Markovian simulation of the current market signal that GE stock is flashing. That’s information that’s not commonly discussed in public financial circles.
Under the framework of discretized inductive analysis, we assume that the future probabilistic distribution of a stock changes based on the security’s current behavioral state. To use simple terms, if you compare two professional sprinters, with one starting from a downhill position and the other starting uphill, you would assume that the one with the advantage (downhill) is likely to win the race.
I believe the same philosophy applies to the equities market. If GE stock recently came off a rally, the assumption is that it would take more “energy” to keep the rally sustained. However, if GE recently came off a downturn, the assumption is that it would take less energy to reverse course (since the bears theoretically would be exhausted).
In other words, depending on the current state of GE stock, the forward outcome will likely be different. Of course, this inductive assumption is not guaranteed to pan out as expected. However, when we’re dealing with the unknown future, such correlative methodologies are one of the best tools we have.
Putting the Strategy to Work
Using a dataset going back to January 2019, if you were to randomly hold GE stock for a 10-week period, the security would likely land between $280 and $310 (assuming a starting price of $286.73, Tuesday’s close). Probability density would likely peak in a range between $292 and $297.
However, this forward distribution is based on an aggregate of all 10-week sequences. We’re interested in the current signal, which is that in the last 10 weeks, GE stock printed only three up weeks, thereby leading to a downward slope. Under this condition, the forward distribution has a tendency of expanding to between $270 and $330.
Admittedly, peak probability density under this condition is calculated at $295. However, what’s really fascinating is this: while the risk axis has also expanded (from $280 to $270), the reward axis has increased much more (from $310 to $330).
No, it’s not rocket science but from a naïve mathematical perspective, the bulls have a statistical edge in taking a shot over the baseline distribution of GE stock. If you’re willing to risk it, the 320/330 bull call spread expiring June 18 appears very compelling.
On the date of publication, Josh Enomoto did not have (either directly or indirectly) positions in any of the securities mentioned in this article. All information and data in this article is solely for informational purposes. For more information please view the Barchart Disclosure Policy here.
/Broadcom%20Inc%20logo%20on%20building-by%20Poetra_%20RH%20via%20Shutterstock.jpg)
/Palo%20Alto%20Networks%20Inc%20HQ%20sign-by%20Sundry%20Photography%20via%20Shutterstock.jpg)
/PayPal%20Holdings%20Inc%20logo%20and%20money-by%20Sergio%20Photone%20via%20Shutterstock.jpg)

/Microsoft%20Corporation%20logo%20on%20sign-by%20Jean-Luc%20Ichard%20via%20iStock.jpg)