I wrote a recent article for Barchart titled "Will Cotton Find a Level to Bounce From?" The cotton market did find that level and had a decent rally before turning sideways.
I'm not looking for prices to make all-time highs as cotton did back in 2011 when it went to $2.20 per pound. During that time, the cotton market had the perfect storm for a bull market. Cotton stocks were already tightening when China had an unexpected freeze in their cotton-producing regions. Pakistan then had a historic flood, and India decided to ban cotton exports leading to buyers being caught flat-footed for supply.
There is a market saying, "the best cure for high prices is high prices." When prices go up and we want them to go down, we need to stop paying for those goods. Another cure is substituting the high-priced product with a less expensive one. Polyester is the competition for high cotton prices and contributed to the peak in cotton prices.
Speicfications and statistics
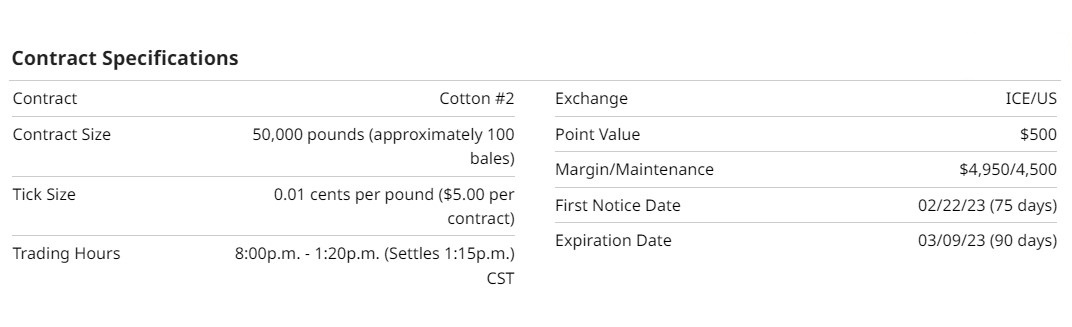
Cotton futures have been trading in the US since 1870 on the New York Cotton Exchange (NYCE). The NYCE was in the World Trade Center when a terrorist attack destroyed it in 2001. The NYCE was temporarily moved to Long Island City until it was acquired by the Inter-Continental Exchange (ICE).
China is the world's leading cotton producer, accounting for approximately 40% of the world's total, surpassing India during 2021/2022. The US is third in rankings.
Cotton requires a long growing season, plenty of sunshine and water during the growing season, and then dry weather for harvesting. The Cotton Belt stretches from northern Florida to North Carolina and westward to California in the United States. In the US, planting time varies from the beginning of February in Southern Texas to the beginning of June in the northern sections of the Cotton Belt.
Cotton is the fifth leading cash crop in the US and is one of the nation's principal agricultural exports. The weight of cotton is measured in terms of a "bale," which equals 480 pounds.
Source: CRB Yearbook/Barchart
Higher corn prices could impact 2023 cotton production. There are reports of the corn/cotton ratio being historically high. The results could lead to smaller plantings of US cotton as farmers react to which crop yields the most significant profit margin.
The third year of a La Nina weather pattern will likely affect South American crops and expand north to Texas, possibly causing poor growing conditions for US cotton.
Recent performance
For the past three months of cotton performance, the market has been down -20%. Year-to-date results are -10%. While these numbers look negative, they could be positive as we approach year-end. Commodity index funds like to reallocate their portfolios at the end of the year in preparation for the next. They always long the markets and look for undervalued ones to increase the index's core position.
Technicals
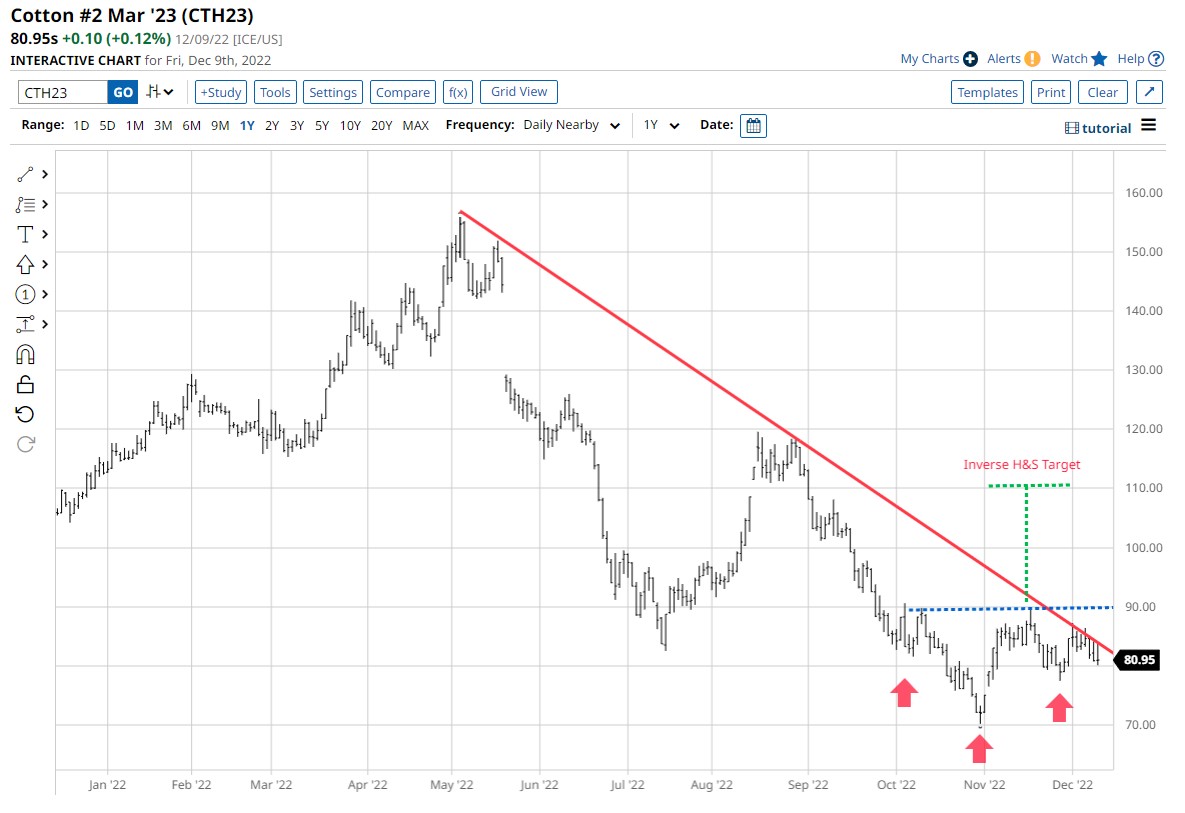
The technical picture shows that the November seasonal lows are holding. As the commercial entities accumulated the market in late fall, the chart formed an inverted head & shoulder bullish reversal pattern. The blue dashed line represents the neckline of the pattern. The target once the neckline is broken is the green dashed line. Some daily closing prices above this line could resume the short-term uptrend.
As you can see, we have a little problem in front of us. From the May highs to current prices, we have a strong trendline that needs to be broken to the upside. Otherwise, we will test the November lows before continuing to rally.
Seasonality
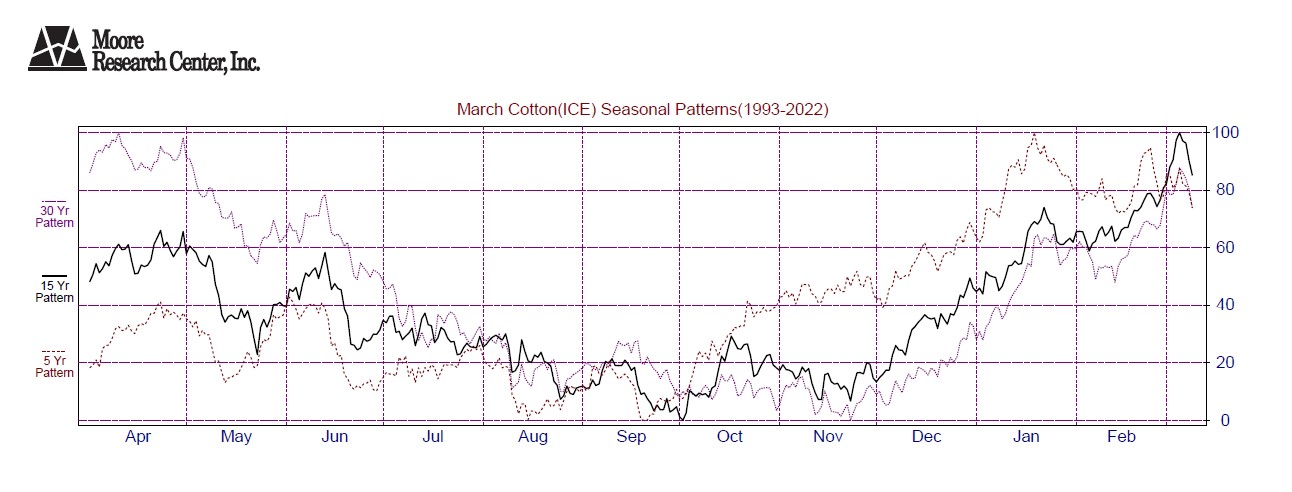
Source: Moore Research Center, Inc. (MRCI)
MRCI has found that the seasonal low in October is usually retested in November. From there, the market has a consistent five and 15-year average for beginning a dominant uptrend into the planting season.
Seasonal analysis should always include using other tools to make trading decisions. Especially with crops due to the many variables that could impact the supply chain. Combining analysis tools will give a trader a better edge in their market analysis.
The Commitment of Traders (COT) Report
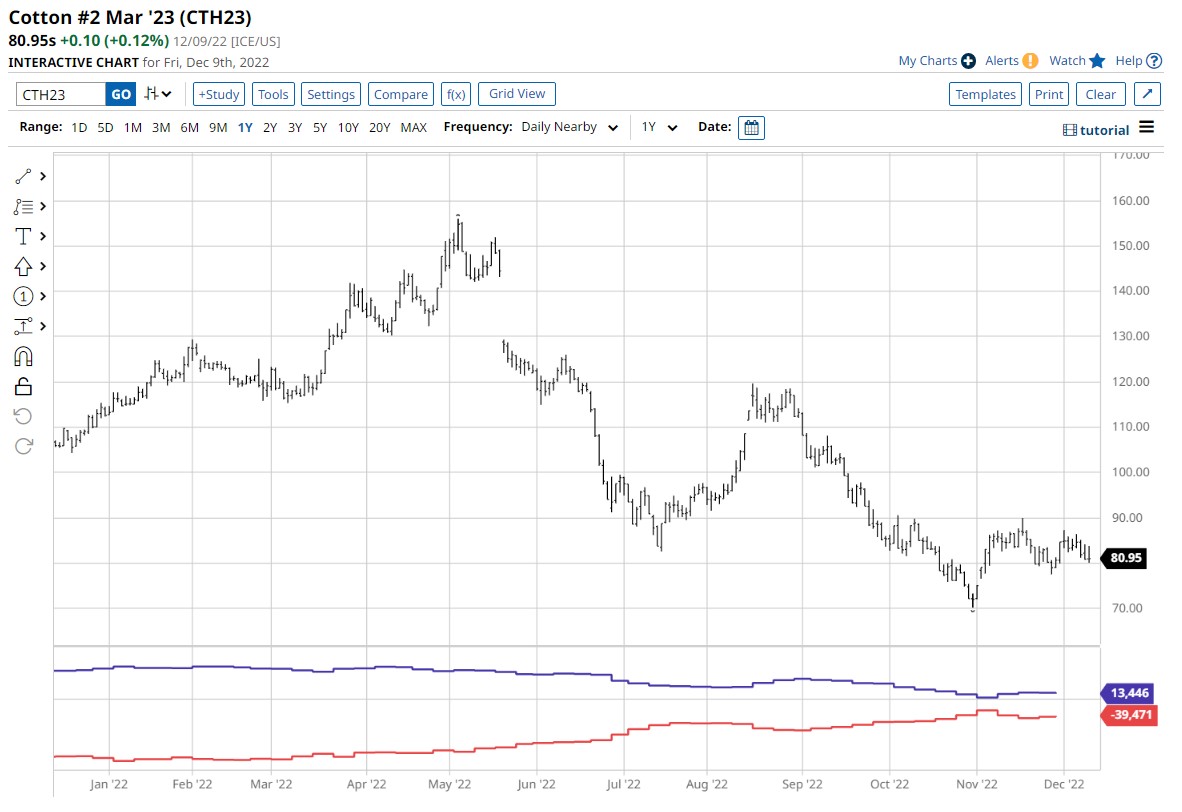
A positive feature of this year's seasonal low strength was that the commercial traders were the aggressive buyers at this low. The commercials (red line) were the most bullish in November than at any time in the past 12 months. This leads me to believe that if the price returns to the November lows, the commercials may accumulate more long positions. During this sideways price action over the past month, managed money (blue line) has been timidly buying this market. A coiled market at a descending trendline could push prices through the resistance once the price breaks out.
Summary
Trade setups like this are helpful for risk management because the November low is a definitive price level of where you're wrong being long. As many of our markets have exhibited low liquidity due to the year's end, we may have to wait a few weeks to get cotton to rally in price.
Keep in mind that the cotton market is highly correlated to stock prices. A strong economy leads to more expendable income.
An exchange-traded note (ETN) for equity traders is available using the symbol BAL as it is indexed to one futures contract of cotton. There is no micro or mini cotton futures contracts, only the standard size cotton (KG) futures contract to trade. As always, do your due diligence before investing your money.
As the price of cotton rallies, let's cross our fingers that the cotton producers have enough supply to prevent attending your office Christmas party in polyester clothing.
More Softs News from Barchart
- Cotton Closes Mid-Range on Friday Gains
- Dollar Strength Knocks Cocoa Prices Lower
- Sugar Prices Undercut by a Slump in Crude Oil
- Arabica Coffee Falls on Brazil Rain and Rebound in ICE Inventories
On the date of publication, Don Dawson did not have (either directly or indirectly) positions in any of the securities mentioned in this article. All information and data in this article is solely for informational purposes.
/A%20close-up%20of%20a%20SpaceX%20sign%20by%20Sundry%20Photography%20via%20Adobe%20Stock.jpeg)


/AI%20(artificial%20intelligence)/AI%20chip%20by%203Dsss%20via%20Shutterstock.jpg)
