
- All three major US stock indexes posted bullish long-term reversal patterns during October before extending newly established uptrends as November unfolded.
- The S&P 500 could see a short-term top develop during December, a move that would fit both its technical and seasonal patterns.
- If so, the first quarter of 2023 would be expected to see the S&P 500 under pressure, without changing the outlook of a long-term uptrend.
Thursday morning marks the first day of December, meaning somehow we have reached the last month of 2022. A look at the news headlines shows us Russia is still in Ukraine, China continues to rattle its saber over Taiwan, and inflation remains a problem central banks around the world continue to struggle with. Beyond that, though, some things have changed, among them the flow of global investment money. In the US, the dollar has fallen out of favor as a safe-haven as an eyeball test of the long-term monthly chart for the greenback continues to show a major top. However, this has opened the door for money to move back into equities, with November seeing the three major US stock indexes building on the bullish reversal patterns completed during October.
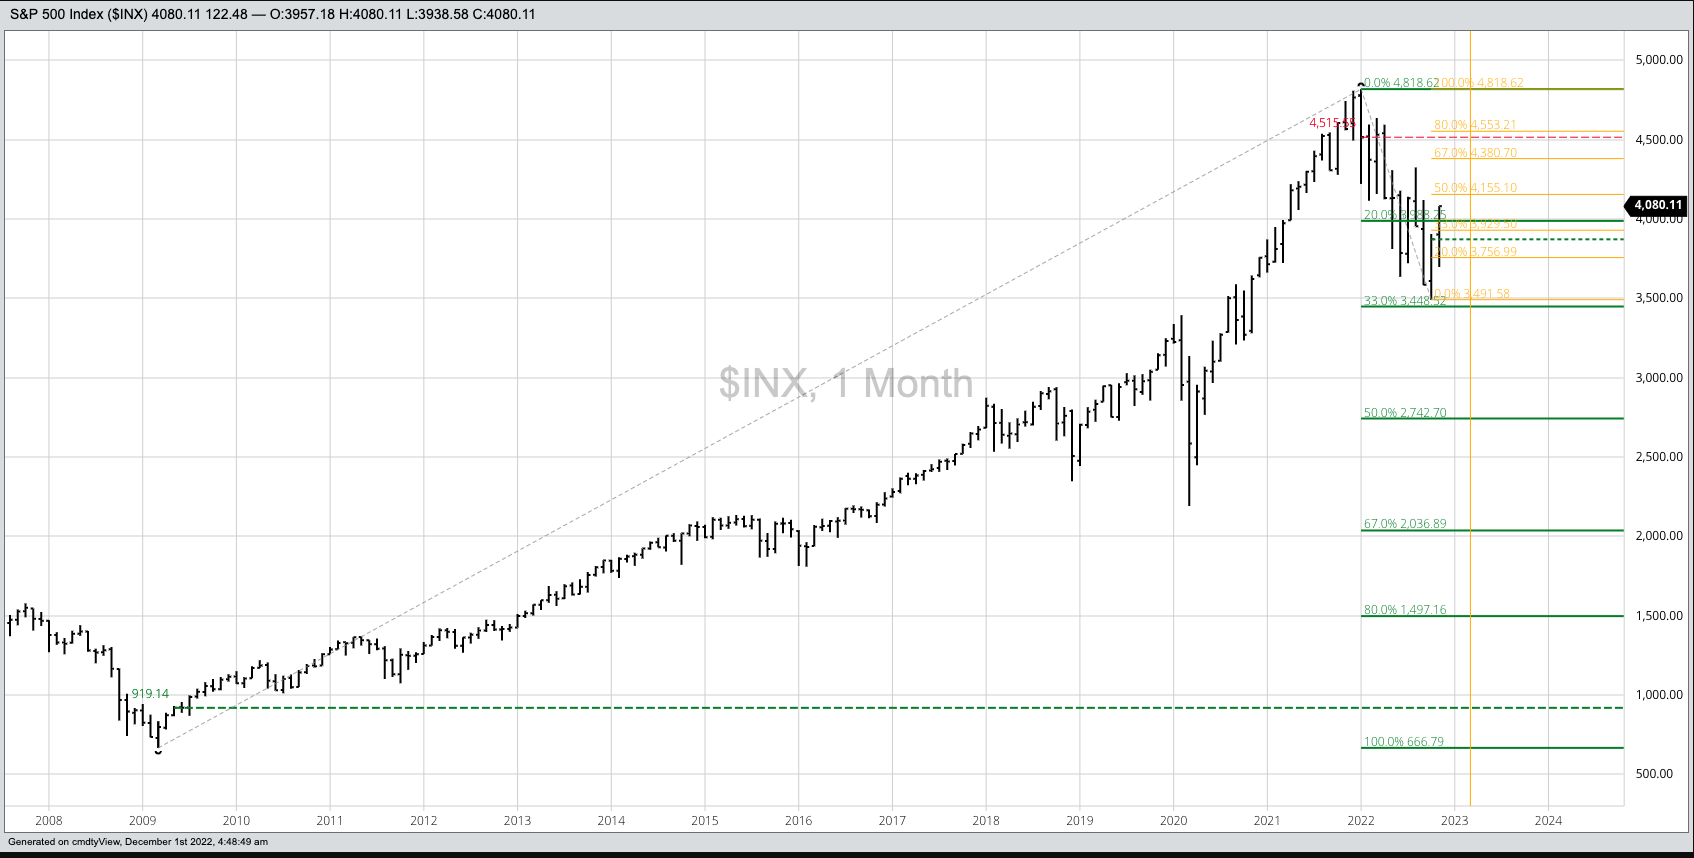
As November drew to a close, the S&P 500 ($INX) was sitting on its monthly high of 4,080.11. This was already a rally of 588.53 points off the October low of 3,491.58, or roughly 44%. If we think of October as the beginning of a new long-term 5-wave uptrend, the move during November means Wave 1 is already fast approaching the 50% retracement level of the previous 3-wave downtrend that began with last January’s high of 4,818.62. That’s a stout move for Wave 1, meaning the index could soon run out of initial gas during December.
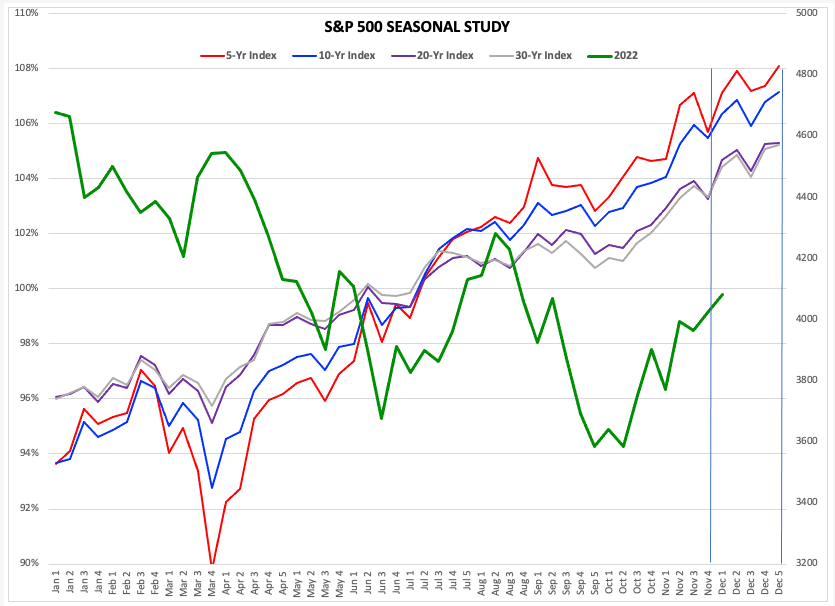
But where, and more importantly when? For this we turn to my seasonal study (based on weekly closes only) for the S&P 500 that shows the 2022 market (green line) compared to its 5-year (red line), 10-year (blue line), 20-year (purple line), and 30-year (gray line) indexes. It’s interesting to note all 4 of the seasonal time lengths show a bottom in late September, a pattern the 2022 market followed with its low in mid-October. What lies ahead, though? Each year about this time there gets to be more talk of a Santa Claus Rally in US stock markets. This study shows the S&P 500 tends to gain 2% from its last weekly close of November (last week) through the second weekly close of December (next week) before holding those gains through the end of the year. The first three days of this week has seen the $INX gain 1.3% from last Friday’s close of 4,026.12, with a 2% rally putting the target for next week’s close near 4,106.60. Note this would be in line with the 50% retracement mark of 4,155.10 on the monthly chart.
What then? Reading headlines Wednesday afternoon as US stock indexes were rallying, one cited Morgan Stanley’s Mike Wilson as predicting a “double-digit percentage drop will hit stocks in early 2023”. This is not as dramatic as it seems, for Wave 2 of the 5-wave uptrend could retrace nearly 80% of Wave 1. And if the first wave peaks near 4,160.00 in December, then an 80% retracement puts the Wave 2 target down near 3,625.00. This would be a loss of roughly 535 points, or a lucky 13% of the S&P 500’s total value. All while the index simply has a normal uptrend play out. How long could Wave 2 last? If we apply the Benjamin Franklin Fish Similarity (Like fish and guests, markets start to stink after three months of going against the trend), then we would expect the second wave to bottom out during March 2023 (gold vertical line).
More Stock Market News from Barchart
- Pre-Market Brief: Stocks Mixed As Slowing Rate Hike Looms, China Reopening Hopes
- Stocks Surge as Fed Chair Powell Confirms a Slower Rate-Hike Pace
- This Canadian Bank Looks Unstoppable
- Unusual Activity in Starbuck Put Options Suggests a Stock Price Dip

/Renewable%20Energy%20by%20Yuri%20Hoya%20via%20Shutterstock.jpg)

/A%20close-up%20of%20a%20SpaceX%20sign%20by%20Sundry%20Photography%20via%20Adobe%20Stock.jpeg)
