The information and opinions expressed below are based on my analysis of price behavior and chart activity
Sign Up to receive Walsh Trading’s 1st Half of 2026 Market Outlook First Half of 2026 Outlook for the Livestock and Grain markets.
Tuesday, April 7, 2026
July Sugar (Daily)
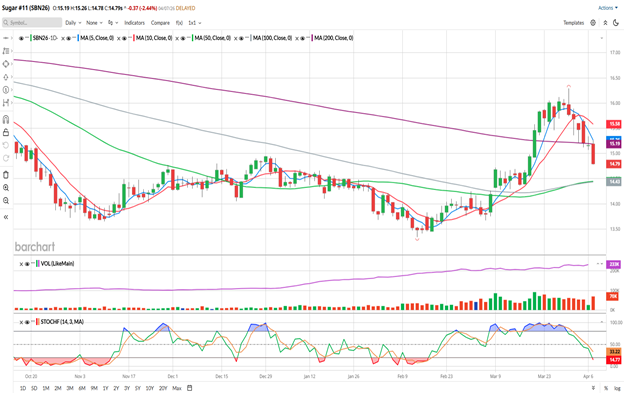
Today, July Sugar closed at 14.79, down 0.37 on the day. Following Monday’s Doji (price equilibrium day, the Bulls had a chance to rally it, the Bears had a chance to push prices lower, nobody won the day, prices came back to where they started) I think that today’s break down lower was bearish.
Like many of the Ag commodities, Sugar got a bullish boost when the US/Iran dealio started. If a resolution to that conflict is not forthcoming and Oil prices zoom toward $150, Sugar may well follow it higher, as it is used as a component (Ethanol) in some international markets for gasoline. My commentary and recommendations are based ONLY on what chart activity shows me, it is not based on any geo-political consideration.
Looking the chart above, I’d like to point out a few things that stick out to me. First off, Sugar prices had been relatively stagnant, with a mild bearish trend from Oct-Feb. The February low of 13.34 sparked a rally for about a month and a half, up to the recent high posted at 16.29 last Monday. That spike high is not usually a bullish sign, in my opinion, as the market closed at/near the lows of the session. Prices then declined to the 200-day moving average (purple) by the end of the week, settling just a tick above that average, usually a measure of long-term trend. Today, that average is at 15.19, offering potential resistance. The 5- and 10-day moving averages (blue/red) made a bearish crossover with Thursday’s trade and are both above the market, also offering potential resistance, at 15.26 and 15.58, respectively. The 50- and 100-day averages (green/grey) made a bullish crossover the day before, on April 1st, and are offering potential support below the market at 14.45 and 14.43, respectively. Stochastics, bottom sub-graph, are declining and are just barely starting to tick into an oversold condition. Looking back over this time frame, Sugar futures seem to have preferred being oversold rather than overbought. There may be a shelf of support around the Nov-Dec highs, but today’s settlement broke below the Dec high of 14.95 and is just a tick above the Nov high of 14.77. Today’s trading volume, just shy of 70,000 contracts, is the highest this market has seen since March 23rd. High volume on a big directional move is usually a sign of more to come, in my opinion.
I think there’s a selling opportunity here, please read on….
July Sugar (Weekly)
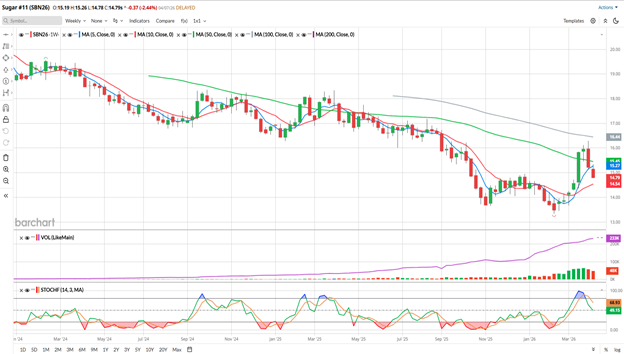
So far for the week, July Sugar is down 0.42 from last week. Yes, I know it’s only Tuesday and there are still 3 days left in the trading week. Last week’s bar posted a bearish engulfment and prices came back below the 50-week moving average (green, 15.45 today) after managing 2 weekly closes above it. The 100-week is grey, at 16.44 today, and has not been tested over the life of this contract. The 5- and 10- week averages made a bullish crossover during the middle of March (the most recent large green bar) but prices have come back below the 5-week (blue,15.27) and appear to be headed toward the 10-week average (red, 14.54) To my eye, this appears to be a similar set-up that we saw in Sugar trade last spring. If you look back, you may notice a bullish cross by the 5- and 10-week averages in February 2025, prices closed above the 50-week average for 6 of the 9 weeks in 2025, before resuming/accelerating a downtrend until November. We’ll have to wait and see if this holds true for 2026.
According to Barchart’s seasonal data for Sugar, it seems to indicate price weakness through April and May and a 50/50 up/down in June over the past 10 years. My seasonal charts indicate weakness over the past 5 years into contract expiration.
Aggressive and well-margined traders may do well to consider short futures positions in July Sugar #11. I think an entry at 14.95 might work out well. I would suggest a GTC reversal stop (if you sold 5, buy 10) at 15.45, which is 11 ticks above Monday’s high. If you sell the market at 14.95 and get stopped out at 15.45, that would result in a $560 loss, per contract, before your commissions/fees. I would look to take a profit on the short futures position at 13.50. If you sold it at 14.95, that would result in a $1,624 gain, per contract, before your commissions/fees. If the sell order does get filled and the market moves lower, you may want to cancel the “reversal” and follow the market down with a trailing stop near the 5-day moving average. If the reversal stop to the upside gets hit, I’ll post another update in this space.
For less aggressive traders, or those that prefer options, I would suggest the July 14.50 Put options. July Sugar options expire in 69 days. The 14.50 Put settled at 0.52 today. I would suggest trying to buy those options at 0.50 or $560 per option, before your commissions/fees. Place a GTC order to take profits at 5x what you paid for the option, or 2.50. If that order if filled, that would result in a gain of $2,240 per option, before your commissions/fees.
Sign Up to receive Walsh Trading’s 1st Half of 2026 Market Outlook First Half of 2026 Outlook for the Livestock and Grain markets.
If you like what you’ve read here and would like to see more like this from Walsh Trading, please Click here and sign up for our daily futures market email.
Jefferson Fosse Walsh Trading
Direct 312 957 8248 Toll Free 800 556 9411
jfosse@walshtrading.com www.walshtrading.com
Walsh Trading, Inc. is registered as a Guaranteed Introducing Broker with the Commodity Futures Trading Commission and an NFA Member.
Futures and options trading involves substantial risk and is not suitable for all investors. Therefore, individuals should carefully consider their financial condition in deciding whether to trade. Option traders should be aware that the exercise of a long option will result in a futures position. The valuation of futures and options may fluctuate, and as a result, clients may lose more than their original investment. The information contained on this site is the opinion of the writer or was obtained from sources cited within the commentary. The impact on market prices due to seasonal or market cycles and current news events may already be reflected in market prices. PAST PERFORMANCE IS NOT NECESSARILY INDICATIVE OF FUTURE RESULTS. All information, communications, publications, and reports, including this specific material, used and distributed by Walsh Trading, Inc. (“WTI”) shall be construed as a solicitation for entering into a derivatives transaction. WTI does not distribute research reports, employ research analysts, or maintain a research department as defined in CFTC Regulation 1.71.