
- Friday, November 18 saw the spot WTI crude oil futures spread move out of backwardation (inverse) for the first time in nearly a year.
- This extended the break by this key read on real supply and demand, a selloff that can be tied to increased US production and the release of oil from the US Strategic Petroleum Reverse.
- However, based on analsis of fundamentals, technicals, and seasonally there may not be much more time and space for WTI futures to move lower.
Friday morning, I saw on the hemorrhaging social media site Twitter, I saw a couple posts from some of the best analysts in the energy sector. The first was from Javier Blas from Bloomberg (and author of the book ‘The World for Sale’) who said, “WTI (crude oil) prompt front-spread has flipped into contango, first time since Dec 2021.” Within an hour, Brynne Kelly posted, “Dec/Jan WTI is now in contango of all things…”. What does all this mean? Sit back and let me tell you a tale.

Recall WTI Crude Oil (CLZ22) is one of the Kings of Commodities, along with corn and gold. Given its title, WTI (the domestic US market as opposed to the global Brent market) is the leader of the energy sector, mostly. The outlier is natural gas, the famed Widow Maker, taking marching orders from no one. As the leader of the sector, the two sides that make up the market (any market) are closely watched. The latest CFTC Commitments of Traders report (legacy, futures only) shows the noncommercial side added another 3,477 contracts to their net-long futures position as of Tuesday, November 15 including a decrease of 6,904 long futures and a decrease of 10,381 contracts of short futures.
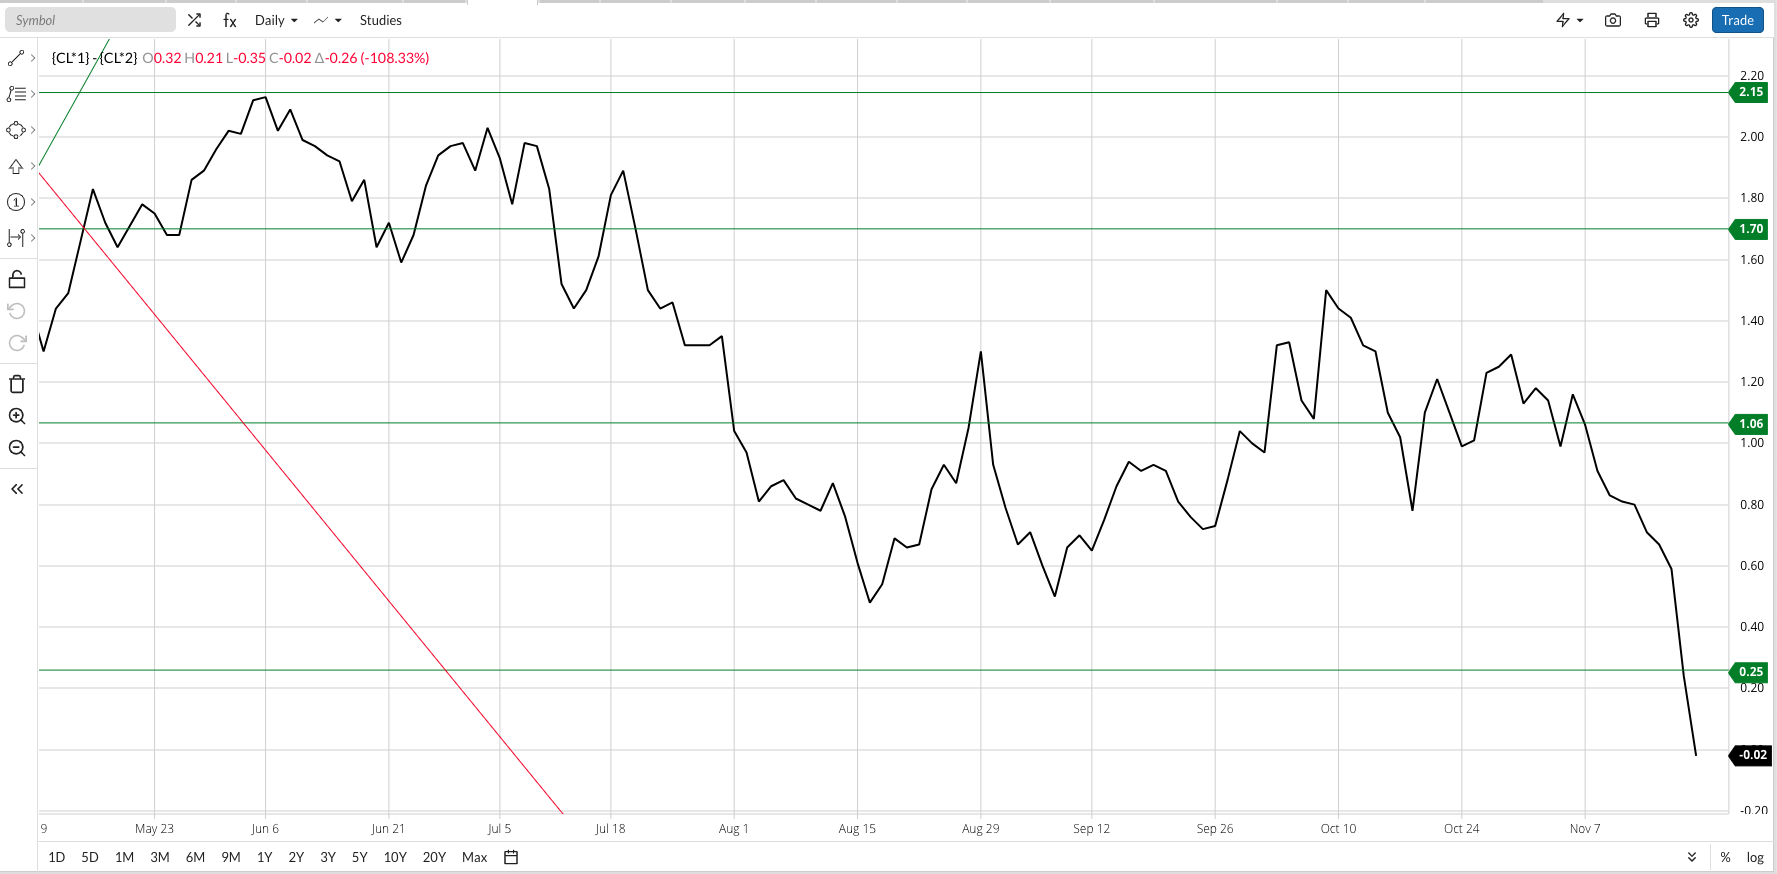
On the other hand, the commercial side has been growing less bullish, as indicated by activity in the market’s futures spreads. A look at the daily close-only chart for the spot spread shows it posted a high of $2.13 (backwardation/inverse) on June 6 and has been generally sliding ever since. Recall from numerous discussions that futures spreads are a read on real supply and demand. In the case of WTI crude oil, what changed? Reportedly this past August saw US oil output climb to roughly 12 million barrels per day, reportedly “the highest since the onset of the COVID-19 pandemic”. All this while demand for crude oil remained strong.
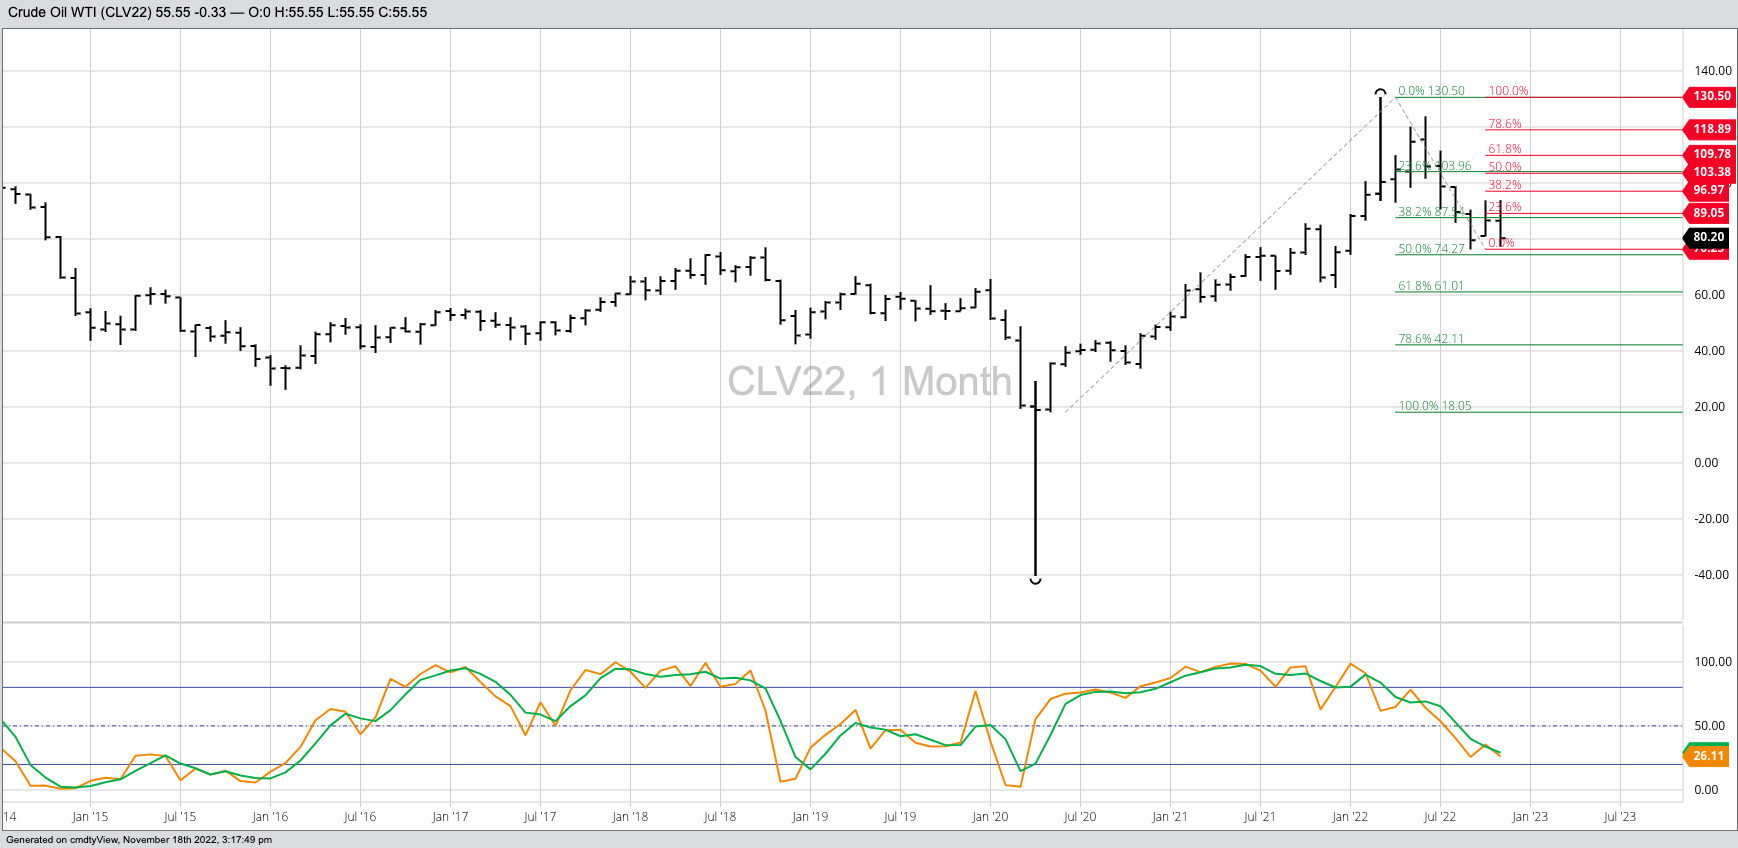
To the equation we can add US President Biden’s announcement on March 31 that “the US will release 1 million barrels of oil per day from its strategic reserves…for the next six months”. This was to be done in an effort to cut gas prices and fight inflation across the US. Now let’s take a look at the continuous monthly chart for the spot WTI contract. The long-term high of $130.50 was posted during March, ahead of President Biden’s announcement. As we make our way toward the end of November the spot-month contract has touched a low of $77.24, with projected support just below at $74.27.
So if the US started releasing oil from its reserves at or near the high, and has theoretically been rebuilding those stocks with increased production as the market fell, the argument could be made the administration sold at the high and is attempting to buy near the lows, just as anyone looking for a good investment strategy would do. Yet this move has been met with ridicule and anger. Go figure.
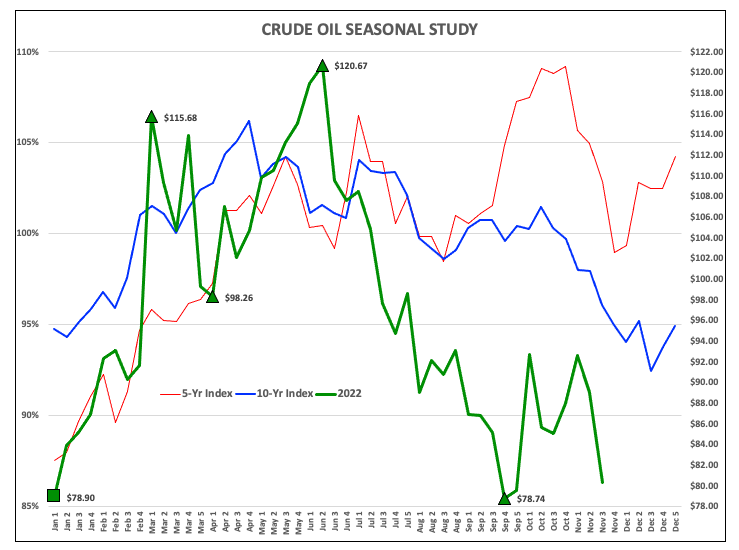
The seasonal chart for crude oil tells us crude oil’s slippery slope could soon bottom out. According to my studies, the 5-year index (red line) shows a seasonal low weekly close between the last week of November and first week of December. The 10-year index (blue line) shows a low weekly close tends to occur the third week of December. Again, the spot-month contract is fast approaching its technical target, and with fundamentals still bullish (a weak contango is not bearish), the 50% retracement level would be expected to hold.
The question has been asked if the breakdown in the spot-spread is a sign of a worsening domestic economic situation. As of this afternoon, I don’t think so, but like with most things this could quickly change. With the US dollar index looking as if it has topped and stock indexes appearing to have bottomed out in October, the US could be moving toward the next stage of a normal business cycle. Much will depend on if King Crude’s slide stops over the next few weeks. Stay tuned.
More Energy News from Barchart
- Nat-Gas Falls Back on Weather Forecasts
- Crude Oil Continues Lower on Demand Worries
- Crude Oil Continues Lower on Demand Worries
- Nat-Gas Pushes Higher on a Smaller Build of Weekly Supplies and Cold U.S. Temps
/AI%20(artificial%20intelligence)/AI%20microchip%20by%20DesignKingBD360%20via%20Shutterstock.jpg)


/A%20Palantir%20office%20building%20in%20Tokyo_%20Image%20by%20Hiroshi-Mori-Stock%20via%20Shutterstock_.jpg)