/PrimeXBT.jpg)
This is sponsored content. Barchart is not endorsing the websites or products set forth below.
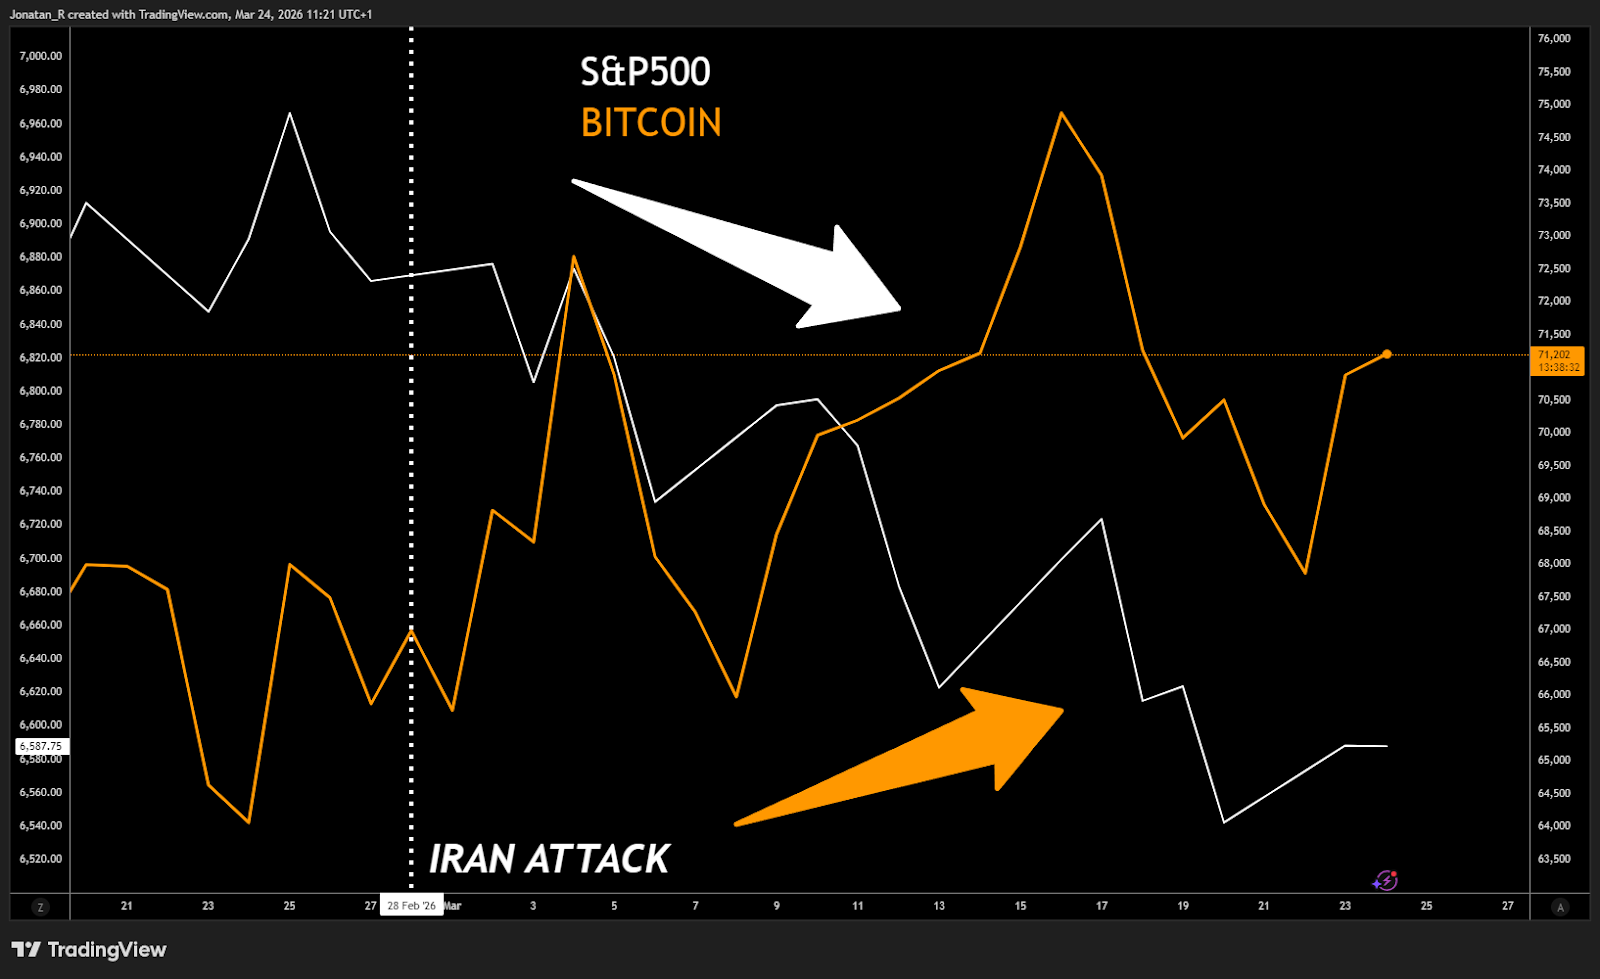
The Iran conflict has become the defining macro event of the first quarter of 2026, reshaping risk appetite across every asset class. But beneath the headline volatility, a structural divergence has emerged that deserves closer attention. Since Operation Epic Fury began on 28 February, Bitcoin has outperformed the S&P 500, gold, and the MSCI World Index. That may sound like a vindication of crypto’s resilience narrative, but context matters.
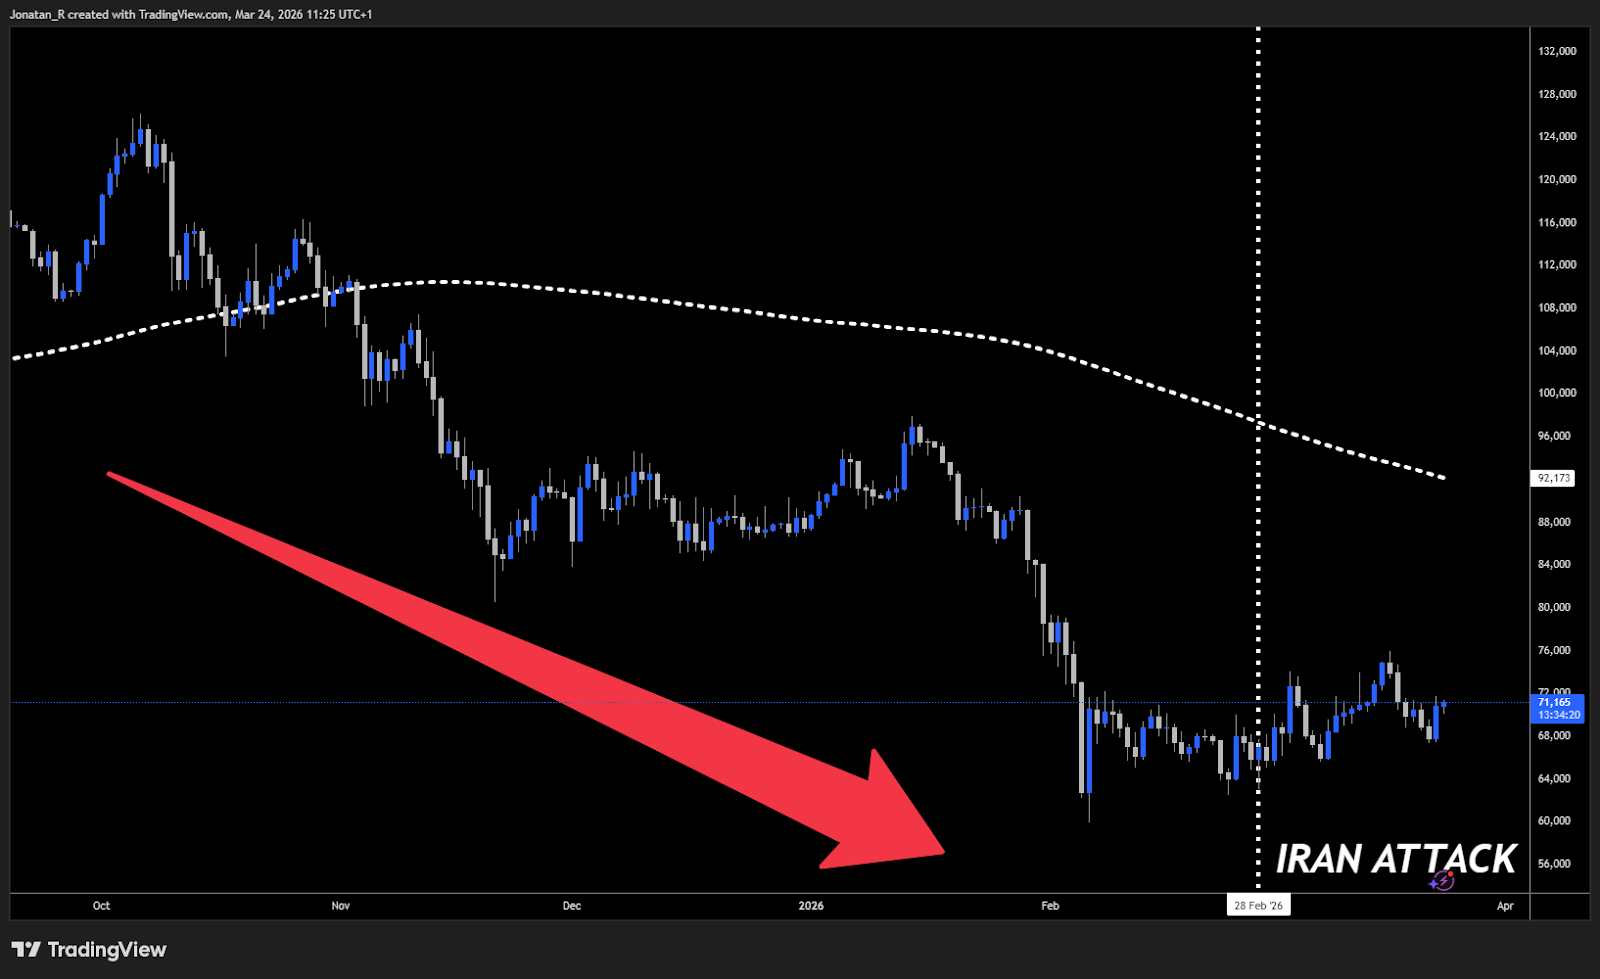
Bitcoin entered the conflict already beaten down. The largest cryptocurrency had fallen roughly 45% from its all-time high of $126,000 in October 2025, spending most of February trading in a $65,000 to $70,000 range. The S&P 500, by contrast, was coming off record highs and carried stretched valuations heading into the year. So when the geopolitical shock hit, Bitcoin may simply have had less downside left to give. The selling pressure had already happened. What is notable, however, is that Bitcoin has not broken meaningfully lower despite a 40% surge in crude oil, a four-week losing streak in equities, and the most significant energy supply disruption in recent memory. Whether that represents genuine structural demand or simply exhausted selling pressure could be the most important question for multi-asset traders in the second quarter.
S&P 500: the 200-day moving average break changes the technical picture
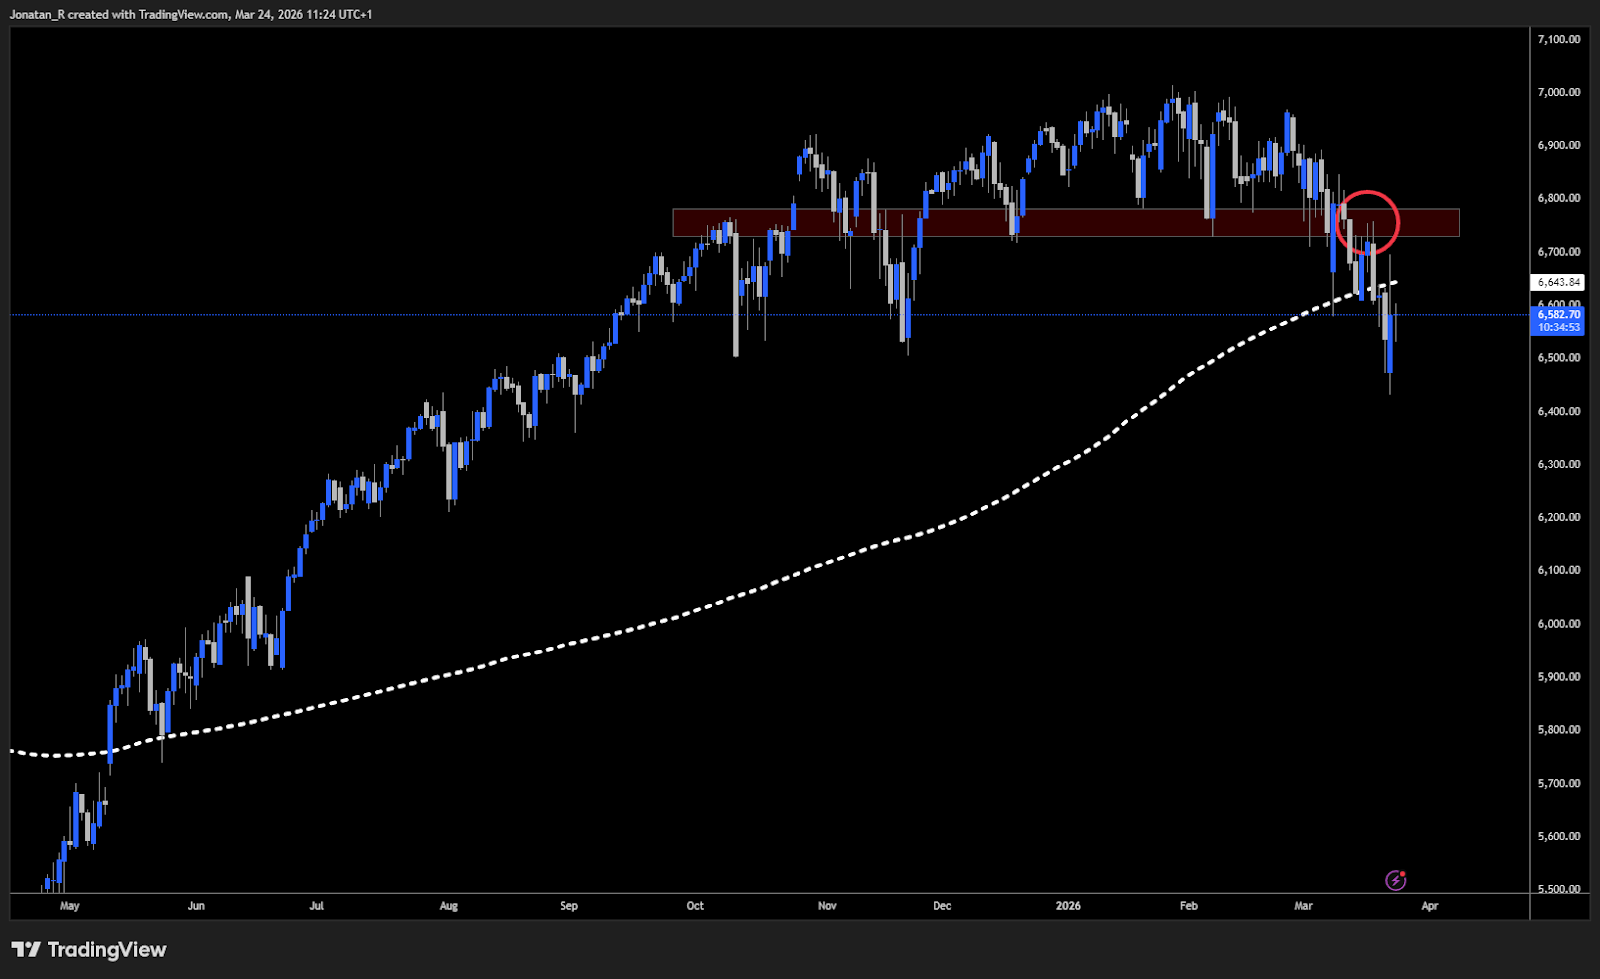
The S&P 500 closed the week of 20 March at approximately 6,606, marking its fourth consecutive weekly decline and, more significantly, breaking below its 200-day moving average for the first time in 214 sessions. That level had served as a reliable floor throughout the post-2023 bull run, and its breach represents a potential structural shift in market leadership and investor confidence.
The key zone to watch sits between 6,731 and 6,782. This range acted as support in December and early February, with the index bouncing from it multiple times before finally breaking down in early March. It is now resistance, and a daily close above it could be the clearest technical signal that the bulls are regaining control.
On the downside, Wall Street’s scenario analysis has widened considerably. JPMorgan cut its year-end target to 7,200 from 7,500 and flagged 6,000 as a near-term risk if headwinds intensify. Goldman Sachs maintained a 7,600 target but outlined a downside path to 5,400 in a severe oil-driven shock. Bank of America’s Michael Hartnett has suggested levels below 6,600 as more attractive for buyers, while Morgan Stanley’s technical views see potential stabilization near 6,400 to 6,500.
The common thread across these projections is oil. As long as Brent crude remains elevated and the Strait of Hormuz disruption persists, the inflation and rate expectations that drove the bull market are being actively repriced.
Bitcoin: Relative strength with an asterisk
Bitcoin dropped to approximately $63,000 within hours of the initial US-Israel strikes on 28 February, a roughly 4% decline that mirrored the reflexive risk-off move across global markets. Within 48 hours, it had recovered to $69,000. By mid-March, it pushed through $75,000, its highest level since the conflict began, before a 48-hour ultimatum from President Trump regarding Iran’s power infrastructure pulled it back below $70,000.
Year to date, Bitcoin remains in negative territory and sits roughly 44% below its October all-time high. The S&P 500 is down approximately 5% year to date. On a purely since-the-war-started basis, Bitcoin has gained roughly 7% while the S&P 500 has lost ground, gold has declined around 5%, and the MSCI World Index is down approximately 4%.
That divergence is worth noting, but it requires an asterisk. Bitcoin’s 89% correlation with the S&P 500 during the sharpest selloff on 19 March could confer that institutional positioning now drives crypto’s short-term price action. Every escalation headline triggers a risk-off move in Bitcoin just as it does in equities. The difference is in the recovery. Bitcoin has repeatedly snapped back within days, while the S&P 500 has ground lower in a series of lower highs. One interpretation: the crypto market had already been through its repricing event, falling from $126,000 to the mid-$60,000s, and the conflict arrived after much of the speculative excess had already been washed out. Another: Bitcoin is beginning to attract a different type of buyer, one focused on currency debasement and monetary policy uncertainty rather than short-term risk appetite.
Oil is the transmission mechanism for both assets
Brent crude’s move from approximately $70 per barrel before the conflict to above $112 at its peak is the single most important variable connecting the S&P 500 and Bitcoin to Middle East risk. The channel through which it transmits differs for each asset, but the source is the same.
For the S&P 500, the pathway is well understood. Higher energy costs compress corporate margins, reduce consumer purchasing power, and feed directly into inflation expectations that delay or eliminate the possibility of Federal Reserve rate cuts. The March FOMC meeting confirmed a hold, and the market is now pricing minimal probability of a cut before the second half of the year. Energy is the only positive S&P 500 sector since the war began, up roughly 6%, while the broader index has declined.
For Bitcoin, the transmission is more nuanced. In the short term, oil-driven inflation expectations tighten financial conditions and weigh on all risk assets, crypto included. Over $1 billion in crypto liquidations followed Trump’s 48-hour ultimatum on 22 March, with 85% of the damage hitting long positions. But over the medium term, the same inflationary pressures that hurt equities may support the case for Bitcoin as a hedge against currency debasement, particularly if central banks are eventually forced to accommodate higher energy costs rather than tighten into a supply shock.
The Strait of Hormuz remains the key variable. Roughly 20% of global oil supply passes through the waterway, and its effective closure since early March has been the primary driver of the energy price surge. Any credible de-escalation or reopening would likely trigger a sharp reversal in oil, which would cascade through both the equity and crypto markets.
Two scenarios for the second quarter
De-escalation: The Strait of Hormuz reopens, Brent crude retreats toward $80 to $85 per barrel, and the inflation premium begins to unwind. In this scenario, the S&P 500 could retest the 6,731 to 6,782 resistance zone, with a break above it opening the path toward a more sustained recovery. Bitcoin could push back above $75,000 as rate cut expectations revive and the risk-on bid returns to digital assets. This is broadly what markets began pricing on 23 March after reports of productive US-Iran talks, with the S&P 500 surging over 2% and Bitcoin reclaiming $71,000.
Escalation or prolonged disruption: Oil remains above $100 per barrel, the Strait of Hormuz stays constrained, and the stagflation narrative hardens. The S&P 500 faces a test of the 6,000 to 6,200 zone, consistent with JPMorgan’s downside scenario. Bitcoin may hold up better than equities on a relative basis but faces downside risk toward $65,000 and potentially a break of current range if inflation expectations prevent any near-term monetary policy relief.
In either scenario, the conflict has already stress-tested whether Bitcoin behaves as a risk asset or a structural hedge during a genuine geopolitical crisis. The answer, so far, is both, depending on the time frame. On any given headline, it trades with equities. Over the course of weeks, it has absorbed the shock more effectively than most traditional assets. Whether that resilience survives a prolonged conflict is the question the second quarter may answer.
Trading cross-market relationships with PrimeXBT
The current environment is defined by interaction rather than direction. The S&P 500 is reacting to tightening financial conditions, Bitcoin is shifting between correlation and independence, and oil remains the central transmission mechanism between them.
Trading this kind of market requires following how capital moves across assets, not just focusing on one in isolation. The recent divergence between Bitcoin’s relative resilience and the S&P 500’s technical breakdown shows how these relationships can create opportunity, but only if they can be acted on in real time.
PrimeXBT, a global multi-asset broker, is structured around this type of market environment. Through its innovative platform PXTrader 2.0, traders can access equity indices, commodities such as oil, foreign exchange, shares, crypto CFDs and crypto futures within a single account. This allows them to respond to the same macro driver across different markets without delay, rather than treating each asset class in isolation.
The role of crypto within that structure is also evolving. In a scenario where Bitcoin reacts to geopolitical headlines in the short term but holds relative strength over longer periods, it becomes both a traded asset and a source of capital. On platforms like PXTrader 2.0, crypto can be used to gain exposure to traditional markets, extending its function beyond price speculation into a more flexible role within a broader trading strategy.
As the second quarter unfolds, the key question is not whether Bitcoin or equities outperform in isolation, but how their relationship continues to shift under the pressure of energy markets and policy expectations. The traders best positioned for that environment are likely to be those who can track and act on these connections as they develop.
Start trading with PrimeXBT.
About PrimeXBT
PrimeXBT is a global multi-asset broker and crypto asset service provider trusted by traders in more than 150 countries. The platform bridges traditional and digital markets within one integrated environment, redefining versatility and innovation in online trading. Clients can access Forex, CFDs on indices, commodities, shares, crypto, and Crypto Futures, as well as buy, store and exchange cryptocurrencies directly. This unified experience extends across both the native PXTrader 2.0 platform and MetaTrader 5, supported by advanced risk-management tools and a wide range of funding options in crypto, fiat and local payment methods. Since 2018, PrimeXBT has focused on empowering traders through broad multi-asset access, fair and transparent conditions, professional-grade technology and dedicated human support. By combining expertise, trust and a client-first approach, PrimeXBT sets a benchmark of excellence in the financial industry and provides traders with the tools they need to trade, grow and succeed with confidence.
Disclaimer: The content provided here is for informational purposes only and is not intended as personal investment advice and does not constitute a solicitation or invitation to engage in any financial transactions, investments, or related activities. Past performance is not a reliable indicator of future results. The financial products offered by the Company are complex and come with a high risk of losing money rapidly due to leverage. These products may not be suitable for all investors. Before engaging, you should consider whether you understand how these leveraged products work and whether you can afford the high risk of losing your money. The Company does not accept clients from the Restricted Jurisdictions as indicated on its website / T&Cs. Some products and services, including MT5, may not be available in your jurisdiction. The applicable legal entity and its respective products and services depend on the client’s country of residence and the entity with which the client has established a contractual relationship during registration.
This article contains sponsored content. Barchart has not reviewed, approved, or endorsed the content, and may receive compensation for placement of the content on this site. For more information, please view the Barchart Disclosure Policy here.
/Nike%2C%20Inc_%20swish%20by-%20Tartezy%20via%20Shutterstock.jpg)

/Server%20racks%20by%20dotshock%20via%20Shutterstock.jpg)

/Super%20Micro%20Computer%20Inc%20logo%20on%20building-by%20Poetra_RH%20via%20Shutterstock.jpg)