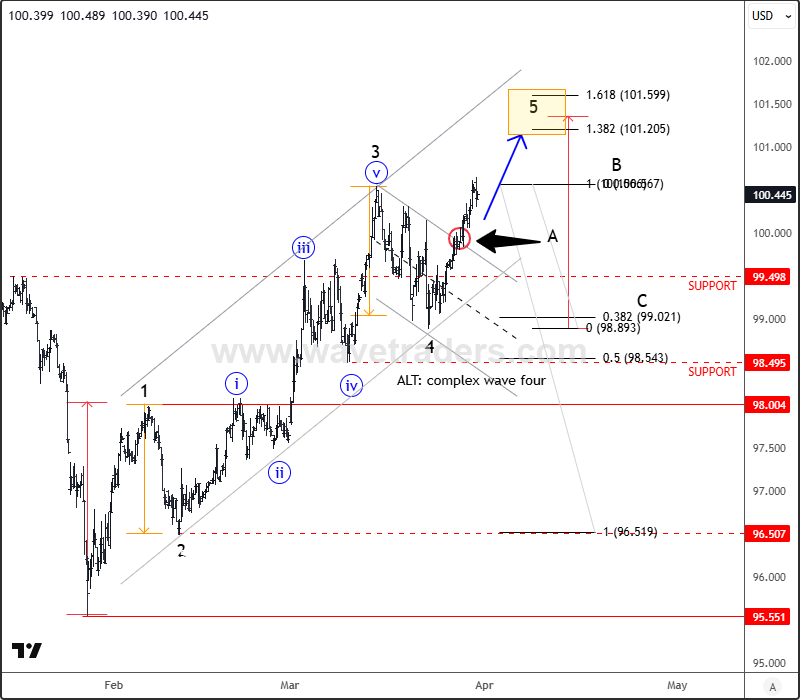
The US Dollar Index (DXY) continues to trade within a well-defined uptrend, with recent price action reinforcing a bullish outlook on the 4-hour chart. The latest recovery appears impulsive in nature, following a controlled pullback toward the 99.00 level, which aligns closely with the 38.2% Fibonacci retracement.
This retracement structure suggests the formation of a classic Wave 4 correction within a broader impulsive sequence. From this support zone, the market has resumed higher, indicating that Wave 5 may now be underway.
Further confirmation of bullish momentum comes from the breakout above the upper boundary of a downward-sloping corrective channel. This technical signal often marks the end of a correction and the continuation of the prevailing trend.
www.wavetraders.com
As long as price action holds above the 99.00 support area, the focus remains on further upside, with the next key target seen near the 101.00 level. This region could mark the completion of the current five-wave impulsive structure.
However, traders should remain cautious as the market approaches this resistance. Once a five-wave move completes, Elliott Wave theory suggests the market typically transitions into a three-wave corrective phase.
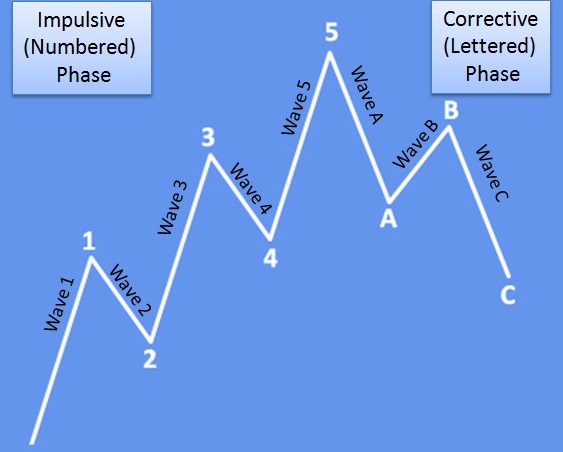
Basic Elliott Wave Guidelines:
According to Elliott Wave principles, a complete market cycle consists of a five-wave impulse followed by a three-wave correction:
- Impulse Phase (Waves 1–5): Moves in the direction of the main trend.
- Wave 1: Initial move higher.
- Wave 2: Corrective pullback, often retracing a portion of Wave 1.
- Wave 3: Usually the strongest and longest wave.
- Wave 4: A corrective phase, often shallow and complex.
- Wave 5: Final push in the trend direction, often showing signs of weakening momentum.
This five-wave structure is typically followed by an ABC correction:
- Wave A: Initial counter-trend move.
- Wave B: Temporary retracement against Wave A.
- Wave C: Continuation of the correction, often matching or exceeding Wave A.
www.wavetraders.com
In the current context, a move toward 101 could complete Wave 5, after which an ABC corrective phase may unfold, potentially driving the index back toward the 99.00–98.00 support zone.
In summary, the short-term outlook for the Dollar Index remains bullish, but traders should be alert for signs of exhaustion near 101, as this could signal the beginning of a broader corrective phase.
For a detailed view and more analysis like this, you can watch below our latest recording of a live webinar streamed on March 30:


