
- Copper has long been viewed as a global economic indicator, and despite nearly every headline to the contrary, the market looks to be moving into a stronger intermediate-term uptrend.
- Technically, the December contract has quietly been moving through the early stages of a 5-wave uptrend pattern without the support or global investor buying interest.
- This means much of the support has come from the commercial side, a factor confirmed with the uptrend in the Dec-March spread back into inverted territory.
Market legend has it that Copper ((HGZ22) has a “PH.D. in Economics”, hence the moniker Doctor Copper. I don’t know if this is true, but what has been proven over time is copper’s role as global economic indicator. Given this, you might be like me, looking at the December contract’s weekly chart and saying, “Doctor Copper, give me the news…”. Why? For despite all the hand wringing, rending of garments, and gnashing of teeth it looks as if Dr. Copper’s intermediate-term trend has turned up.
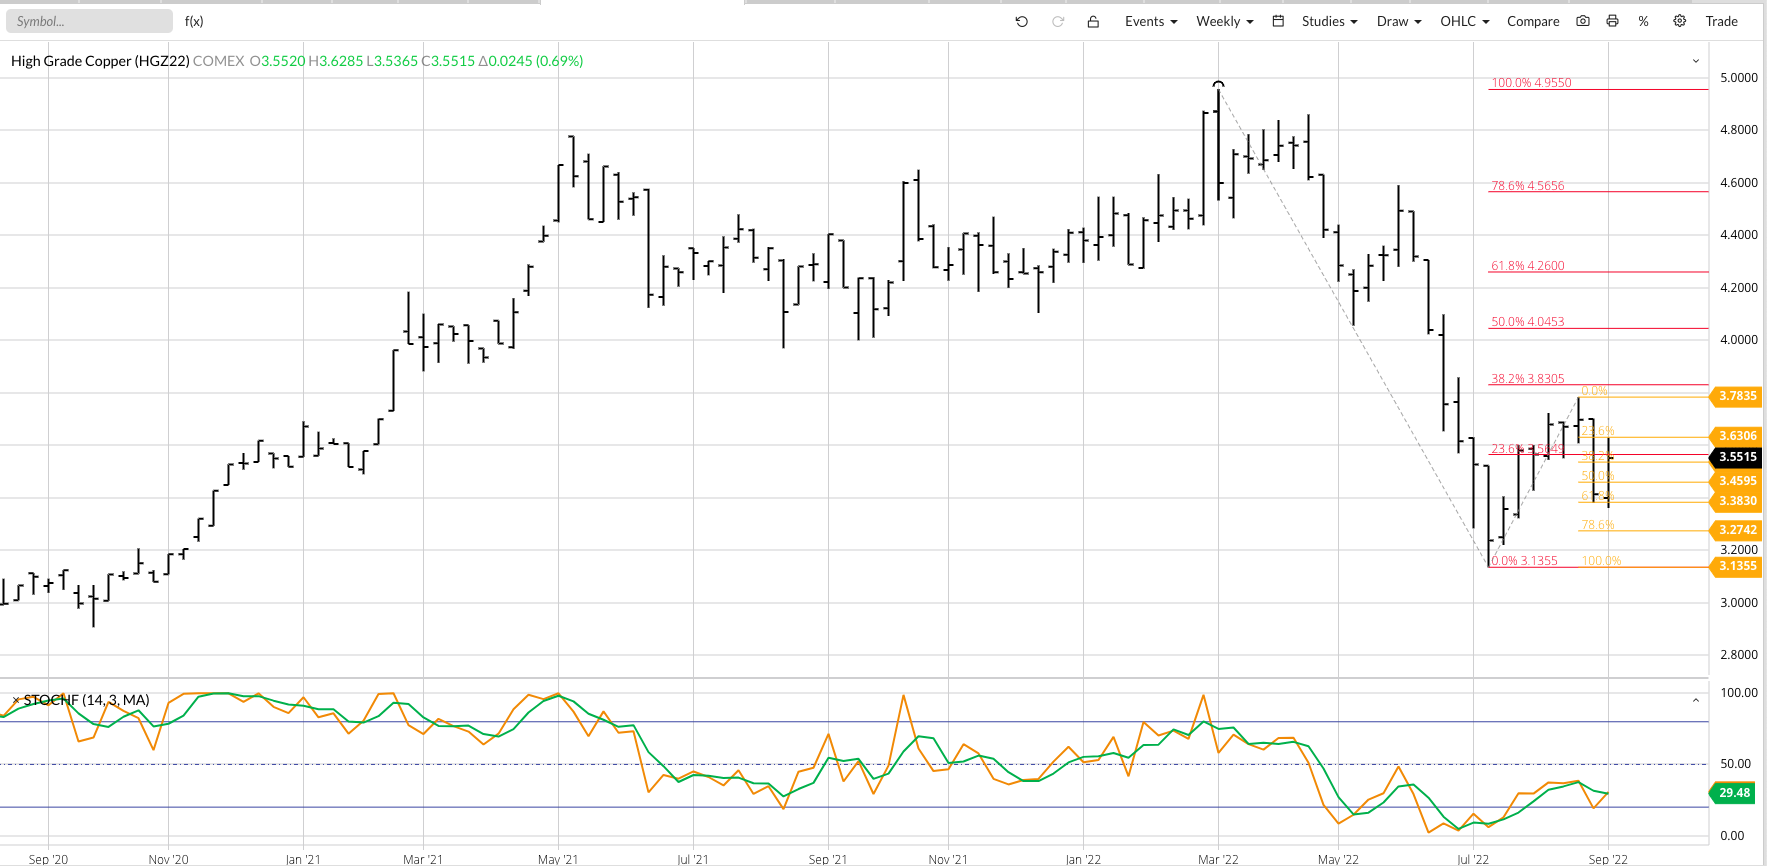
If I take the label off this weekly chart and view it as simply Market A, I see a clear 5-wave uptrend in the making. Wave 1 ran from the low of $3.1355 (week of July 11) through the high of $3.7835 (week of August 22). As of this writing, Wave 2 looks to be short-lived as this week saw Dec copper spike to a low of $3.3610 before rallying to $3.6285 overnight through early Friday morning. If the contract can somehow stay close to its high through Friday’s weekly close, then it would complete a bullish spike and 2-week reversal indicating Wave 3 has likely begun. I hedge my bets a bit because Wave 2 tends to retrace more of Wave 1, usually coming in at about 80% and putting the low target closer to $3.27. This time, though, the contract looks to have uncovered buying interest near the 61.8% retracement level of $3.3830. If Dec copper is indeed in Wave 3 of its new uptrend, it is expected to take out the Wave 1 high with the next upside targets at $3.3805 and $4.0455. These prices mark the 38.2% and 50% retracement levels of the previous downtrend from $4.9550 (week of March 7) through the July low.
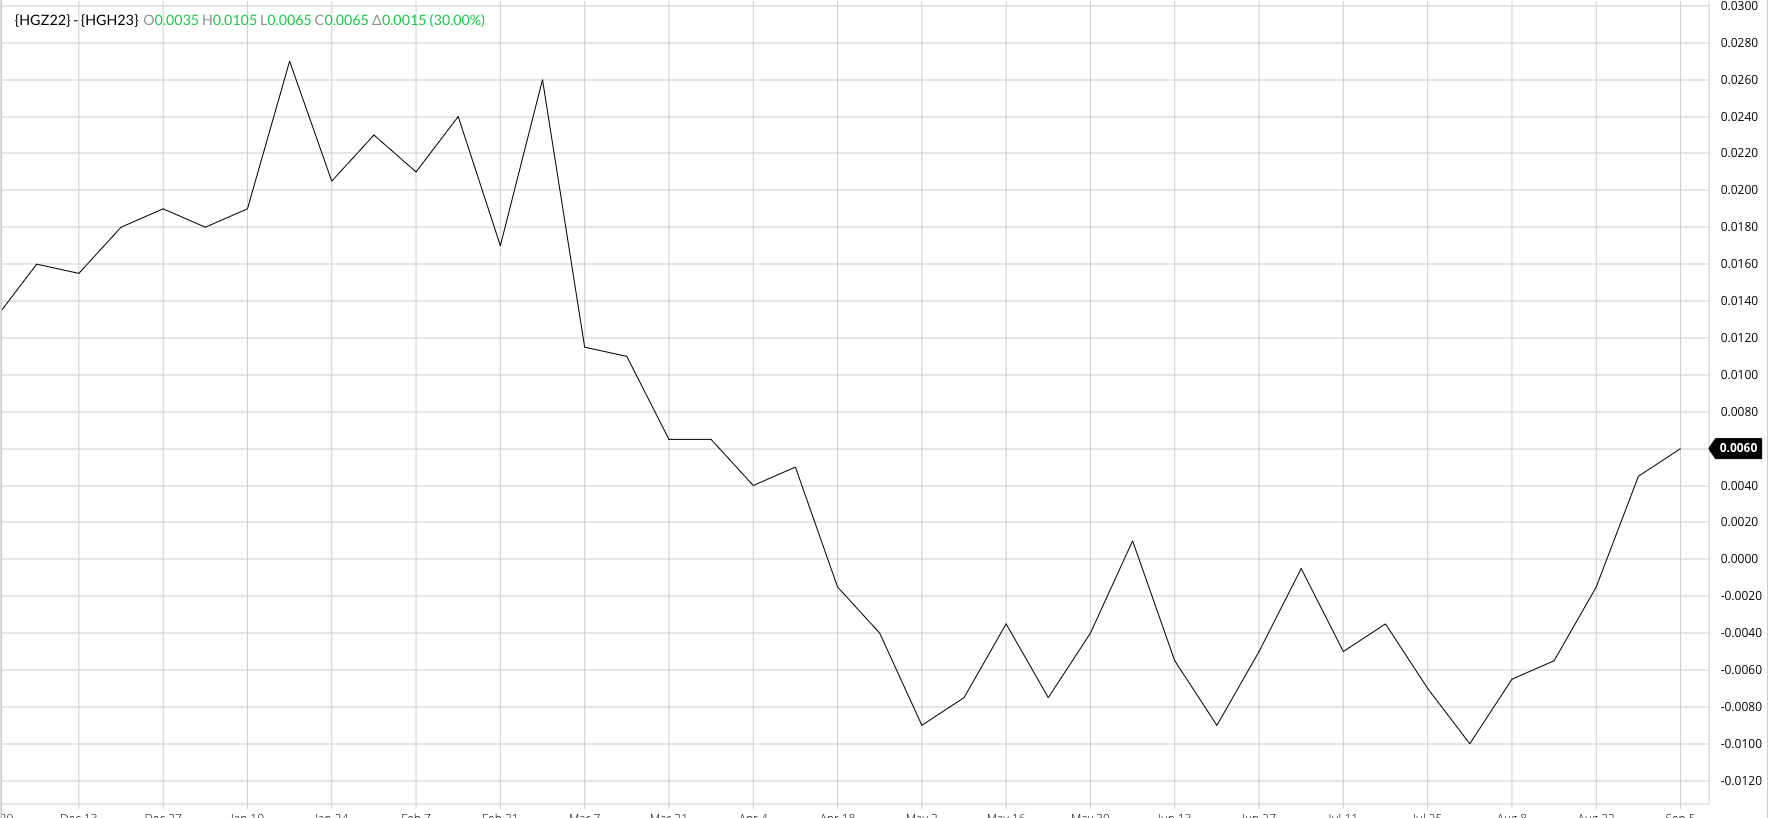
Fundamentally the futures market is a bit tricky, as to understand futures spreads we need to look at those contracts with open interest and trade volume. For now, that narrows are study of spreads to the Dec-March where we see another solid uptrend on the daily close-only chart, putting the spread at in inverse (or in backwardation for the New York crowd). And as we can all recite from Dr. Seuss’ Horton Hears a Who, “An inverse is an inverse, no matter how small”, and when it comes to storable commodities inverses are always fundamentally bullish.
Does this fit with what financial media tells us all day every day? Not really. It doesn’t matter where one chooses to get their news, it’s nearly all the same: Global economies are collapsing, and the world is headed toward Armageddon. Okay, I might’ve over-dramatized a bit, but you get the point. The latest news is China continues to struggle with its zero-Covid policy, shutting down major cities and raising warning flags over economic ripple effects that could be felt around the world. I like to think of it as another Beijing Butterfly, the symbol of Chaos Theory and its “A butterfly flaps its wings in Beijing and creates a storm in New York”.
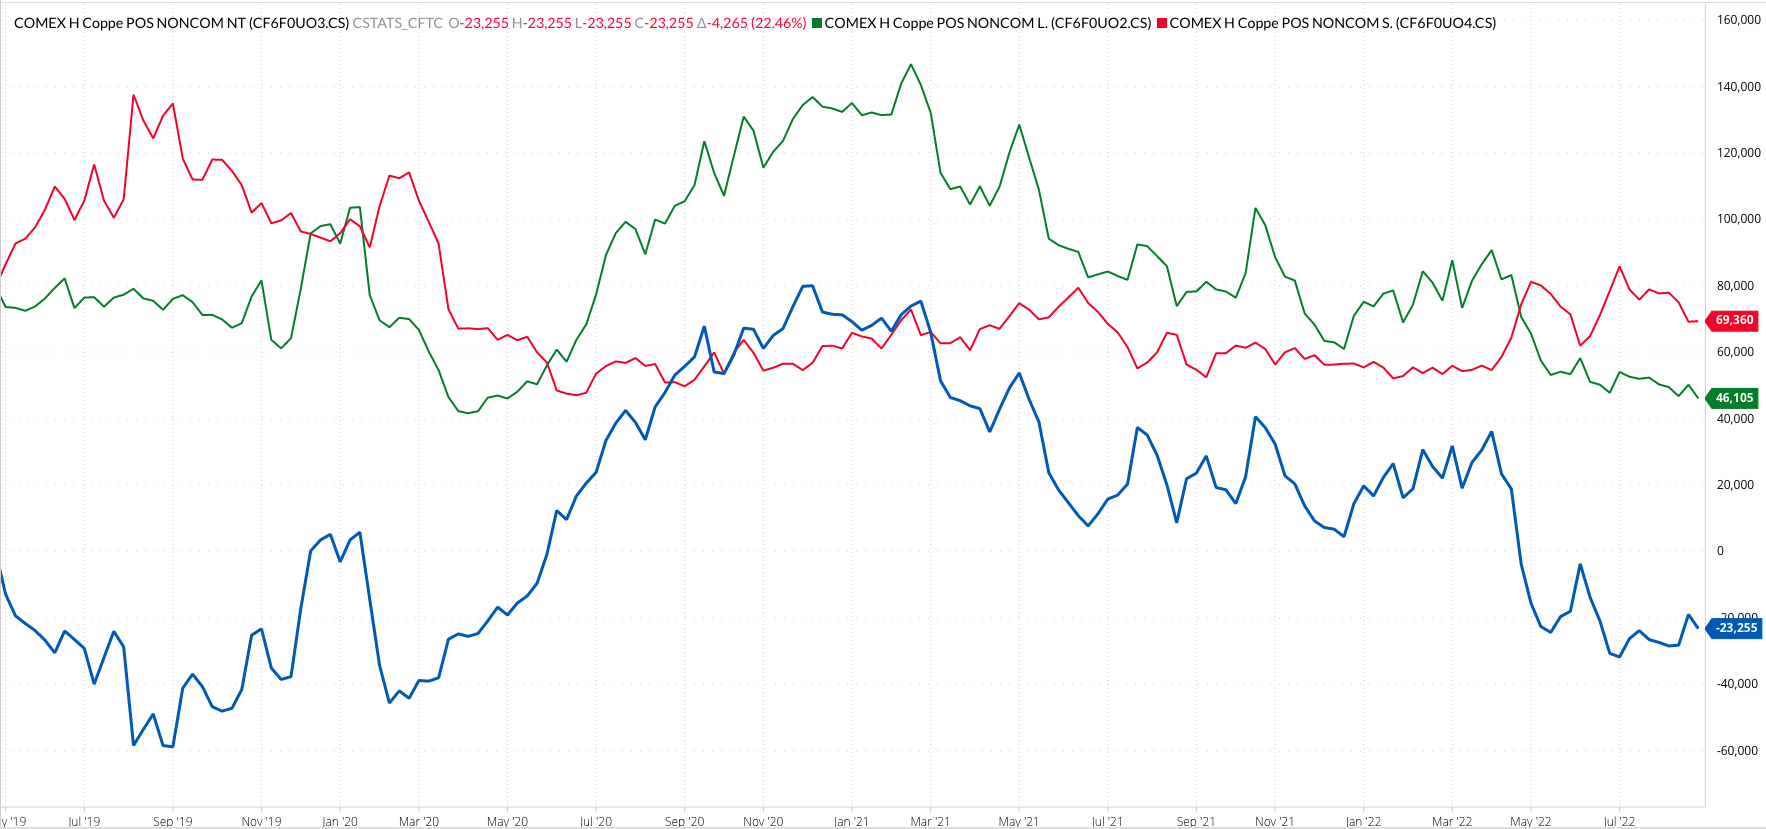
Here's where Newsom’s Market Rule #5 comes into play, though. It’s the what, not the why. We may not know the real reasons why copper is rallying, but the what is a new uptrend is being built on buying interest from both commercial. Noncommercial interests have been slow to react, as seen in recent CFTC Commitments of Traders reports (legacy/futures only, the only one that matters), with last week showing an increase in the group’s net-short futures position. This opens the door to a stronger rally in futures when this group starts to cover those short futures.
More Metals News from Barchart
/Micron%20Technology%20Inc_%20logo%20on%20building-by%20vzphotos%20vis%20iStock.jpg)


