
[[ type === 'moc' ? 'MARKET ON CLOSE' : 'FREE WEBINAR' ]]
[[ timeLabel ]] WATCH LIVE:
Your browser of choice has not been tested for use with Barchart.com. If you have issues, please download one of the browsers listed here.
Stocks | Futures | Watchlist | News | More
or
Your Free 7-Day Premier trial ends on . Extend Your Trial For Another 30 Days. Time remaining
Faster, Cleaner, Better.

Rmg Acquisition Corp Cl A (RMG)

Rmg Acquisition Corp Cl A (RMG)
[[ item.lastPrice ]] [[ item.priceChange ]] ([[ item.percentChange ]]) [[ item.tradeTime ]] [NYSE]
[[ item.bidPrice ]] x [[ item.bidSize ]] [[ item.askPrice ]] x [[ item.askSize ]]
[[ session ]] by (Cboe BZX)
[[ item.lastPrice ]] [[ item.priceChange ]] ([[ item.percentChange ]]) [[ item.tradeTime ]] [NYSE]
[[ item.bidPrice ]] x [[ item.bidSize ]] [[ item.askPrice ]] x [[ item.askSize ]]
[[ session ]] [[ item.lastPriceExt ]] [[ item.priceChangeExt ]] ([[ item.percentChangeExt ]]) [[ item.tradeTimeExt ]]
Historical Data for [[ item.sessionDateDisplayLong ]]

Symbol Historical Price Data Downloads

Barchart offers two great products for Historical Market Data:

A Barchart Premier Membership lets you download historical price data for any publicly available symbol we carry in our database. Access Stocks, ETF's, Mutual Funds, Futures, Commodities, Forex and Cryptos - you can download daily data back to the inception of our database, or 1-minute data going back 10-years.

  • Intraday data is available, down to 1-minute increments, approximately 10 years prior to today's date.
  • Daily data is available back to 01/01/2000.
  • Weekly, Monthly, and Quarterly data is available back to 01/01/1980 (depending on the symbol).
  • Up to 10 daily downloads (Barchart Plus) or 250 daily downloads (Barchart Premier), whether individual symbol price history, your Screener results, Watchlists, or for other popular Barchart pages.
  • Download additional underlying chart data and study values for any symbol using the Interactive Charts.
  • Get 1000 daily downloads, including options data, with a Barchart Premier membership

Get More Download Flexibility On Historical Data With Barchart for Excel

Barchart for Excel is a powerful tool designed to enrich the data you can find on Barchart.com, but with the added power and flexibility of Microsoft Excel. Blend Barchart data with your own proprietary data, perform calculations, visualize data, and perform sophisticated data analysis directly in Excel. Start your free trial today. Billing begins on the first business day of the next month.
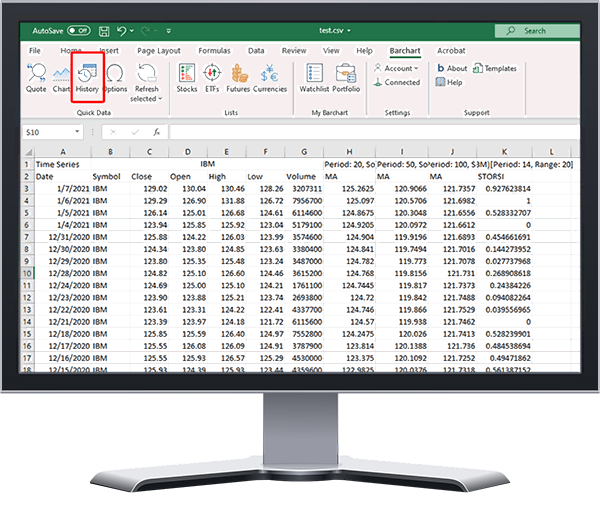
Barchart Historical Data Downloads

With Barchart for Excel:

  • All the Historical Data Download features from Barchart Premier, PLUS ...
  • No restrictions on historical start dates, Intraday data back to 01/01/2009 and Daily data back to 01/01/1980.
  • Tick data available, along with optional subscription to real-time exchange data.
  • Download an unlimited amount of financial data directly into your spreadsheets, up to 100,000 rows of data.
  • Easily blend data from Barchart with your own proprietary data or other 3rd party data sources directly in Excel.
  • Pull historical data into Excel for deeper analysis with 3rd party tools/languages such as MATLAB, R, Python and others.
  • Apply study data from nearly 100 technical indicators directly to Excel.
Start Your Free Trial Today

Billing begins on the first business day of the next month,

Download Reset Download
Download historical Intraday data (when available) back approx. 10 years, down to 1-minute increments. Daily data is available back to 01/01/2000, with Weekly, Monthly, and Quarterly data back to 01/01/1980. A maximum of 20,000 records can be downloaded with any single request. US Equity Options minute data starts March 2023.

Download additional underlying chart data and study values using the Interactive Charts.

Futures data is available by contract, or choose "Nearby" data for continuous data. Contracts will roll based on total volume and open interest. For expired futures contracts, enter the 2-character commodity root (ZC, GC, etc.) followed by the 1-character month code, followed by a 2-digit year. Example: ZCZ05 for Corn December 2005.

Get More Download Flexibility On Historical Data With Barchart for Excel

Barchart for Excel is a powerful tool designed to enrich the data you can find on Barchart.com, but with the added power and flexibility of Microsoft Excel. Blend Barchart data with your own proprietary data, perform calculations, visualize data, and perform sophisticated data analysis directly in Excel. Start your free trial today. Billing begins on the first business day of the next month.

Barchart Historical Data Downloads

With Barchart for Excel:

  • All the Historical Data Download features from Barchart Premier, PLUS ...
  • No restrictions on historical start dates, Intraday data back to 01/01/2009 and Daily data back to 01/01/1980.
  • Tick data available, along with optional subscription to real-time exchange data.
  • Download an unlimited amount of financial data directly into your spreadsheets, up to 100,000 rows of data.
  • Easily blend data from Barchart with your own proprietary data or other 3rd party data sources directly in Excel.
  • Pull historical data into Excel for deeper analysis with 3rd party tools/languages such as MATLAB, R, Python and others.
  • Apply study data from nearly 100 technical indicators directly to Excel.
Start Your Free Trial Today

Billing begins on the first business day of the next month,


Want API Access?

Barchart offers historical data through Barchart OnDemand. Barchart OnDemand provides both premium market data delivery through a collection of web services APIs (JSON, XML and CSV formats) and a limited free service. For more information, please visit: Barchart OnDemand: www.barchart.com/ondemand

You can also contact Barchart Sales at 866-333-7587 or solutions@barchart.com for more information or additional options about historical market data.

New Highs

Period
Made
New high
Percent
From Last
5-Day 4 times -30.59%
1-Month 8 times -30.59%
3-Month 13 times -30.59%
6-Month 24 times -30.59%
YTD 37 times -30.59%
52-Week 38 times -30.59%
2-Year 42 times -30.59%

New Lows

Period
Made
New low
Percent
From Last
5-Day 2 times +12.03%
1-Month 2 times +109.63%
3-Month 9 times +168.92%
6-Month 2 times +170.68%
YTD 6 times +184.21%
52-Week 8 times +184.21%
2-Year 11 times +199.00%
Want to use this as
your default charts setting?
Save this setup as a Chart Templates
Switch the Market flag
for targeted data from your country of choice.
Open the menu and switch the
Market flag for targeted data from your country of choice.
Want Streaming Chart Updates?
Switch your Site Preferences
to use Interactive Charts
Need More Chart Options?
Right-click on the chart to open the Interactive Chart menu.
Use your up/down arrows to move through the symbols.