The Ultimate Covered Call Screener (Find High-Probability Trades Fast)
If you search for "covered call" on YouTube, you'll get tons of full-length videos and shorts discussing the topic, from what the strategy is to what metrics to look out for to the risks involved in selling them.
But here's the funny thing. For all the content out there, very few talk about the one thing that actually makes covered-call trading easier, faster, and far more consistent: having a covered call screener that works.
A good covered call screener can filter entire markets in seconds, highlight opportunities that fit your trading parameters, and essentially cut through the noise to showcase the only things that matter.
That's why today, I'm going to show you my ultimate covered call screener and how you can use Barchart to your advantage.
First, let's start with definitions.
A call option is a contract that gives the buyer the right, but not the obligation, to buy a specific asset, such as a stock or commodity, at a specified price, or strike price, before or at a specified time or expiration date. When you buy a call, you enter a long position and pay a premium for the contract, usually expressed per share.
When you sell, or write a call, you enter a short position and receive a premium for the contract, and that's in exchange for the obligation to sell 100 shares of a stock per contract if the buyer exercises their right to buy the shares. From the seller's point of view, this is called "assignment."
A covered call is "covered" because you already own the shares, and therefore, you no longer need to buy them from the market should you get assigned.
For this article, I'll assume you don't already own the shares and that you'll buy them and then sell the call option. So technically, that's a buy-write, but if you already own the shares, it's a covered call.
Covered Call Screener - Default List of Results
Barchart has a default covered call screener, which you can find right in the Options section.
The default screener includes important details for your trade - all the necessary information to help you decide. The result is a good amount of trades that offer a decent mix of risk and reward.
Later, I'll show you how to customize the screen. But for now, let's stick with the default filters and I'll quickly cover what everything means in the results.
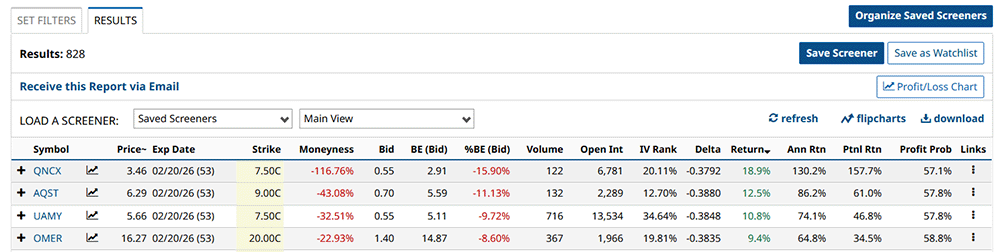
First is the asset's current trading price and expiration date, which is important context when trading options. The parentheses after the expiration date indicates the days to expiration, or DTE.
Next is the actual strike price. Now, for covered calls, you want your underlying asset to trade below your strike price until expiration so you won't get assigned. And I'll talk more about how to choose your strike price later.
The next column is moneyness - specifically, how far away the strike price is from the current price. Negative moneyness means the trade is out of the money, which in this case means the strike price is higher than the trading price. Positive moneyness means it's in the money.
Next is the bid column. This shows how much people are willing to pay for the specific covered call.
Next up is the breakeven column and breakeven percentage, which shows you the exact stock price at expiration where your covered call neither makes nor loses money. Of course, this assumes that you paid the current trading price to buy your 100 shares. If you already owned the stock before, the breakeven will be different.
If you want to calculate the breakeven price, just take your purchase price and subtract the net credit you receive.
Now, we're getting to the good part.
Option volume is just like stock volume - the amount of contracts that were traded in the last session.
Then we have open interest, which is the total number of outstanding, active contracts that have not been settled or closed within the specified expiration period.
You need to know these details in order to see if the option you're interested in selling is liquid. Liquidity here can potentially mean the difference between entering or exiting a trade cleanly… or getting stuck with terrible pricing.
Here's a good analogy. Let's say you're selling fresh bread at the market for a dollar a loaf.
But then you're there the whole day, and nobody buys your fresh loaf. So what do you do? You lower your price to ninety-five cents, to ninety, to seventy, to fifty, hoping someone will take it before the bread goes stale and becomes useless.
That's exactly how illiquid options trading works. If there's no demand to buy your call option, then you'll either have to wait a long time or lower your price to meet the bidders' prices, and all the while, your bread is drying out on the counter while the clock runs down against you.
This can become a problem when you need to adjust or exit the position quickly, and you may end up selling for less or paying a higher premium than you expected.
High volume means you can get filled quickly without chasing the price. And strong open interest tells you there are plenty of other contract owners in play that might be willing to buy.
The next column here shows delta, the options Greek that measures how much option premiums change based on every $1 change in the underlying's price.
By the way, I made an entire video covering Greeks, so check it out if you want the full deep-dive.
Aside from that, delta can also be used as a shorthand indicator of the chances that an option will expire in the money.
For example, a negative 27-delta covered call means the trade has a 27% chance of expiring in the money. Of course, it also means the option has a 73% chance of expiring out of the money - which is the goal in selling covered calls.
Next, we have return, annualized return, and potential return.
Return, shows how much you're earning for this trade relative to your assumed purchase price, which, again, is the current stock trading price. Annualized return just expands the actual return to show what it would look like on a 12 month basis.
Potential return, meanwhile, assumes that you get assigned and it combines the sale of the stock and the premium for the covered call.
Next, and this is likely where most new traders look into the most, is the profit probability. This metric displays the likelihood of the underlying stock trading above the strike price at expiration - meaning, assignment. The higher the probability, the better your chances of walking away with profit from the stock sale AND the option premium. It's that simple.
Profit/Loss Chart
Now, if you want to dive further into your trade details, you can click the P/L chart button right here or the chart icon beside the expiration date.
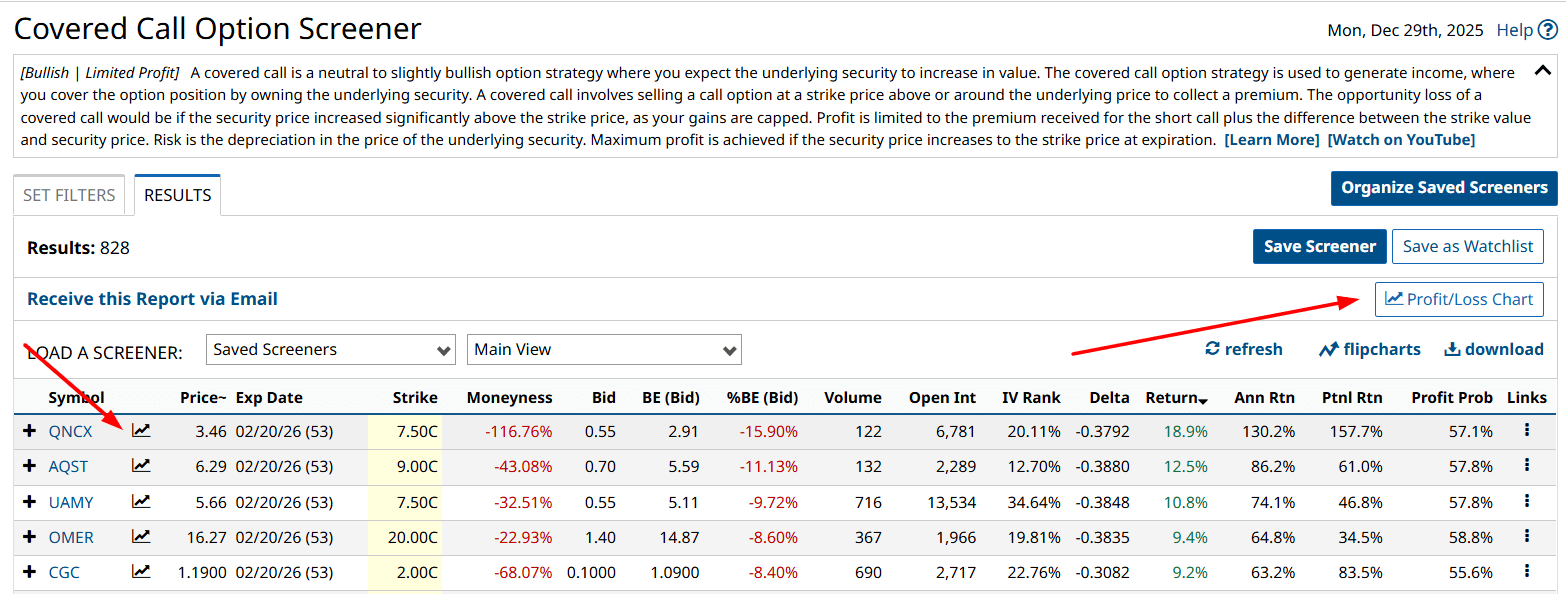
Here, you'll get everything that matters: breakevens, Greeks, volatility, trend strength, all of it.
I covered how to use the P&L chart when selling covered calls in this video, so feel free to check it out.
For now, let's cover a few key tabs - Greeks and Expected Move. In the Greeks window, you usually want to keep an eye on delta and theta.
Now, we already covered delta. Theta indicates how much the option will lose in value each day, assuming everything else stays the same - including the underlying security's price.
Theta measures how much an option's value changes each day due to time decay. For long options, theta appears as a negative number because the option loses value daily. For example, a theta of -0.10 means the option drops about 10 cents per day if the underlying doesn't move.
For short options, theta is positive. The meaning is the same, but the effect benefits the trader, since the option's value decays and the short position gains from that decline.
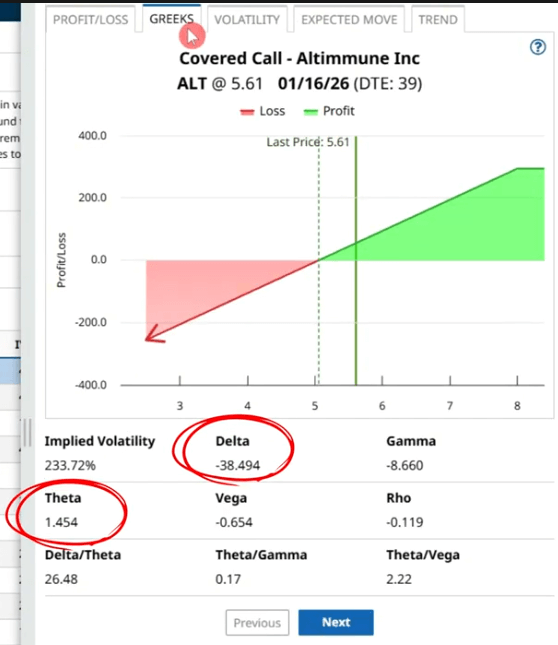
The expected move tab shows the anticipated upper and lower price ranges for the stock's trading price based on 85% of at-the-money straddle premiums.
When you're selling a covered call, you'd usually want to set your strike price a bit above the upper range. That way, you decrease your chances of getting assigned.
Next - Set Your Filters
So, now that we have the default screener ready and its results, what do we need to do to bring it to the next level?
You'll start by clicking the Set Filters tab. Here you'll get all the default filters, and their values. Then, you can do your own customization.
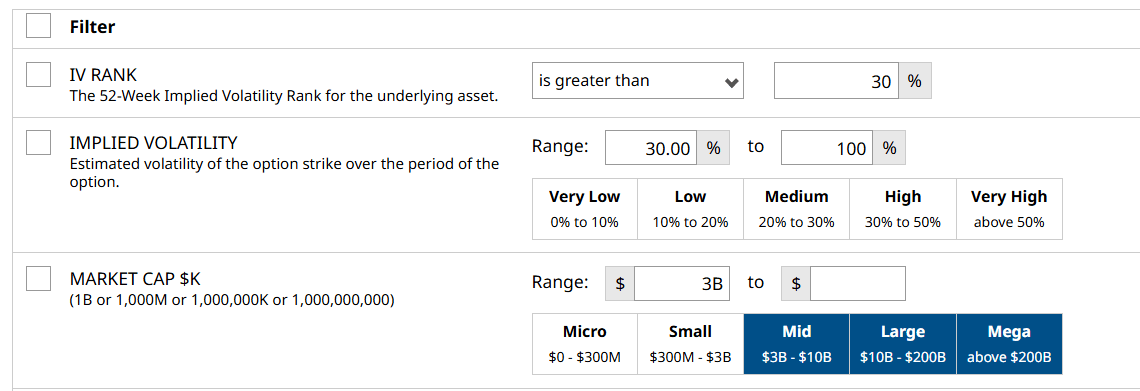
When selecting stocks to sell covered calls on, I prefer to limit my selection by adding the Market Cap filter and setting the values to $3 billion and above. That way, I avoid small and micro-cap companies.
Then, I add the implied volatility filter or IV. IV tells me how much an asset's price is expected to move. IV is critical because it directly impacts option prices. The more the market expects a stock to move, in either direction, the higher the options premiums become, regardless of direction.
I'll set the filter to search for 30 to 100% for implied volatility.
Then, I add IV rank. This measures the current IV's position compared to the past year, or more specifically, where it sits in the range. For example, if IV is high now compared to the past, IV Rank will also be high, meaning premiums or options prices will be higher than usual. I'll set IV rank to 30% and above.
Lastly, I'll scroll down to the security type filter and add in ETFs, then in the days to expiration or DTE filter, I'll add in weekly options to expand my search.
And now view your results.
The Ultimate Screener: Fine-Tune Your Results
But what if you want to fine-tune it more? I mean, you're reading this because you want to see my ultimate screener, right?
Well, here's what's cool. Barchart's Option Screener also integrates with the stock screener, which means you can access all these stock filters for your screen.
But, of course, that many choices often lead to confusion, so let me suggest two of the best filters you might want in your ultimate covered call screener.
First, we have the RSI rank. RSI, or the Relative Strength Index, is a popular technical indicator that tracks the stock's recent price movement and plots it on a 0-100 range to measure its momentum.
Anything above 70 is considered "overbought," while anything below 30 is "oversold."
RSI rank is a convenient filter that allows you to screen for stocks that have recently reached certain levels in that range. I set it to look for stocks with RSI above 70, either recently or currently.
![]()
I like to use RSI rank with my Covered Call screener because RSI gives you a quick read on whether a stock is short-term overbought or oversold, which directly affects your timing and expected outcome.
When a stock is near the overbought territory, it doesn't automatically mean it's about to reverse, only that it has recently experienced strong upward momentum.
For covered call sellers, that's actually a favorable setup: a sharp run-up often leads to elevated option premiums, and the call you're selling is more likely to be priced higher due to both higher IV and increased demand.
On top of that, stocks that have just surged tend to cool off, consolidate, or at least their growth slows down. Those environments are ideal for covered calls because you benefit if the stock stalls below your strike, letting the option decay rapidly while you keep the premium.
Now, if you prefer a different method, you can use the Bollinger Band Rank or BBR filter instead of RSI Rank. It works similarly to RSI Rank, but uses Bollinger Bands as the base technical indicator. Bollinger Bands are a volatility-based technical indicator that consists of three lines: a middle band, usually a simple moving average, and upper and lower bands set a certain number of standard deviations away from the middle band. These bands expand when volatility is high and contract when volatility is low.
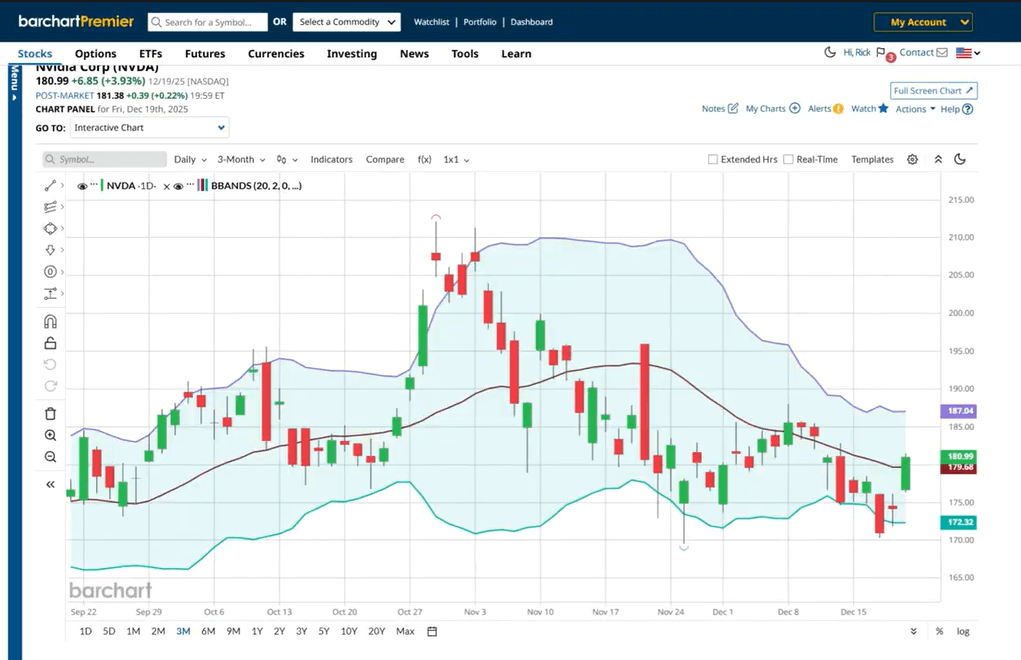
A stock trading near the upper band will have a high BBR, while a stock near the lower band will have a low BBR.
You can use the New and Above Upper options to limit the results to stocks currently trading above the upper bands.
![]()
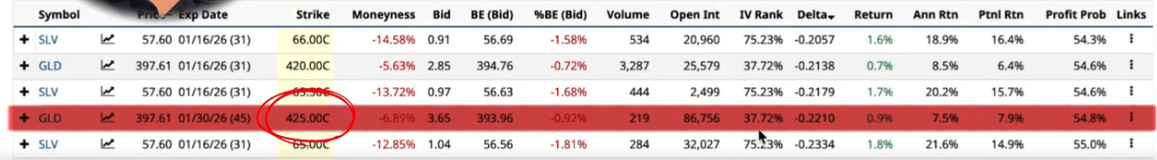
This makes them prime candidates for selling covered calls because the stock may struggle to move significantly higher before potentially pulling back. Now, using the initial RSI filter, let's look for a potential trade. Right now, these are the results, which you can then choose from any of them based on delta, premium, or probability of profit.
This fourth trade actually caught my eye. This is a 425-strike covered call on a Gold ETF, which is trading around $397. The covered call expires on January 30, 2026, 45 days from now. If you sell this call, you'll receive $3.65 per share or $365 total at the start of the trade.
And if we check the expected move tab, we can see that GLD is expected to trade at around $417 on the higher end by January 30, which means this 425-strike call is probably safe from assignment.
Jumping over the Greeks tab, the trade has a negative 22 delta, which is well below my preferred limit of negative 30.
Plus, remember, this trade met my screener criteria. It has an RSI of 70 or above, which means it's trading at overbought levels and the underlying's price may struggle to move higher.
Final Thoughts
By selling covered calls, you can earn a consistent income or squeeze additional profits from your short-term trades. It all depends on your investment goals. It also lowers your cost basis of the stock.
But to make it work, you need to find the perfect trade, and this is where Barchart's complete set of features can help you out. If you use them consistently and effectively, you'll be well on your way to seeing appreciable improvements in your trade.
However, the trade doesn't end with the "perfect" filter. It's always best to stay on top of your trade after you get a fill. I like to set alerts on the underlying assets I'm using for my options trade. To do that, all you need to do is go to the stock profile page, click alerts right here, click add alert, then set and adjust your preferences. I usually set this filter to Price & Volume, then the latest available price or the closing price, then set a figure a few dollars below my strike price so I know if it's getting close.
Now if the stock price does go through a reversal and approaches your strike price while your trade is still active, you need to be prepared to make a decision.
If you don't want to lose your shares because of assignment, you can close your current call and buy another one, essentially rolling it up to a higher strike price, a longer DTE, or both. Be aware, though, that this might mean additional costs that could eat away at or completely reverse your net credit. Remember, this isn't a get-out-of-jail-free card; it's a tactical move that requires consideration, so only do this if you believe the new trade still has a chance to work out in your favor.
On the other hand, if you don't want to keep the shares long-term, just let the call get assigned, pocket the gains from the sale and the net credit, and move on to another opportunity.