The Only Technical Indicators Options Traders Actually Need
I’m a conservative investor, so when it comes to stocks, I usually start with fundamentals. I want to know how the company is performing, whether the business model works, and if the stock is fairly valued.
But options trading is a different game. Timing matters more than fundamentals. Price movement and trends have a much bigger impact on option pricing than whether a company had a good quarter.
That’s why many options traders rely on technical analysis. It helps identify trends, improve timing, and define clear entry and exit levels.
The problem is, there are dozens of technical tools out there, and using too many just adds noise. Instead of clarity, you end up with conflicting signals.
So which ones actually matter?
Today, I’ll cover the most effective technical analysis tools for options trading and show you how Barchart’s stock and options screeners can help streamline the entire process.
Intro to Technical Analysis
Technical analysis is the study of price action and trading volume to predict future market moves. Instead of looking at a company’s financials, technical analysis focuses on trends and patterns. It’s widely used in all types of trading, especially when timing is just as important as the underlying asset itself.
You might have heard the more common ones like moving averages, chart and candlestick patterns, or indicators like RSI or MACD, or Fibonnaci retracements.
Now, the old way you do technical analysis is to manually study charts, draw trendlines, and calculate indicators by yourself. I’ve been trading for over 20 years, way before we had easy access to everything on the internet, so believe me when I say this takes a lot of time. The good thing is, with Barchart, we save you a bunch of time.
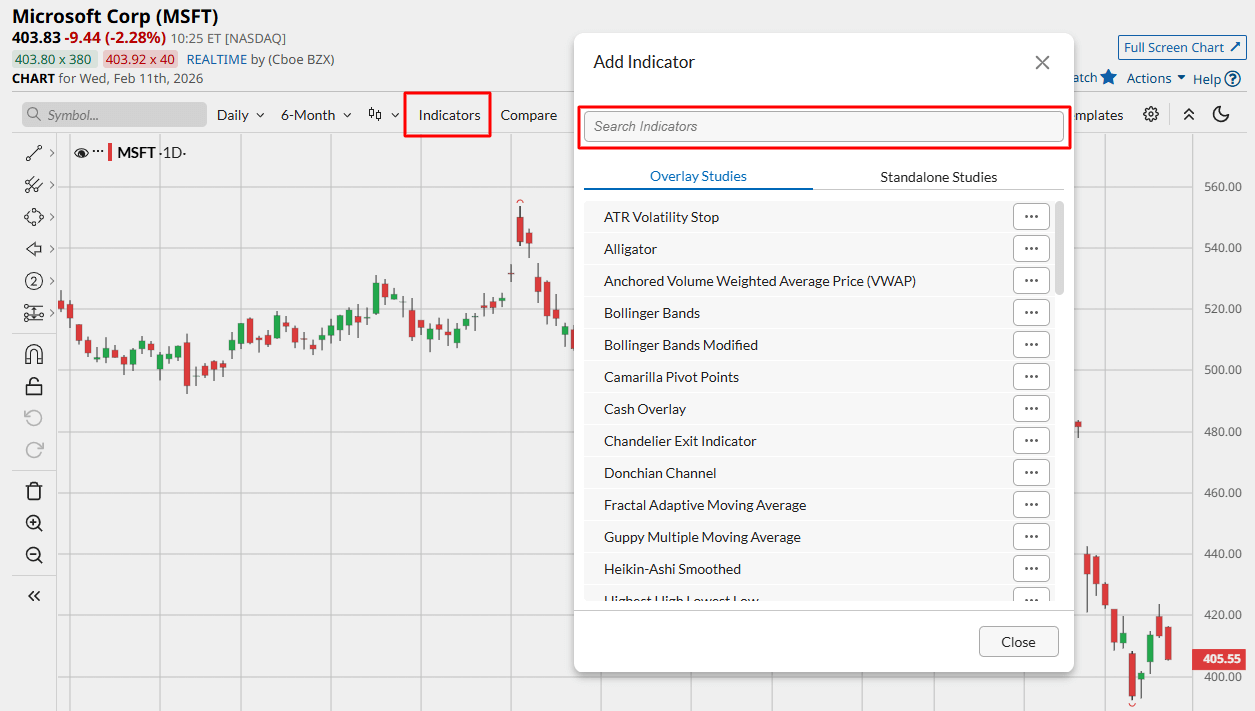
Here’s an example. Visit the stock's profile page for any company that you want to analyze, then go to the interactive chart page. From there, click on Indicators, and you can search, add, and delete whatever indicator you need for your analysis.
Moving Averages
Moving averages are one of the simplest and most widely used tools in technical analysis. They smooth out a stock’s price into a single line over a set period of time to show the overall trend, instead of every tiny up-and-down tick.
A simple Moving Average adds up the closing prices over a period, say, 50 days, and divides by the number of days to get a value. Then, those values are plotted against the stock chart itself. You can change the number of days to your preferred, but the most common ones are 20, 50, 100, and 200. These correspond to short-, medium-, and long-term averages.
A more advanced version, the Exponential Moving Average, or EMA, gives more weight to recent prices, so it reacts faster to changes.
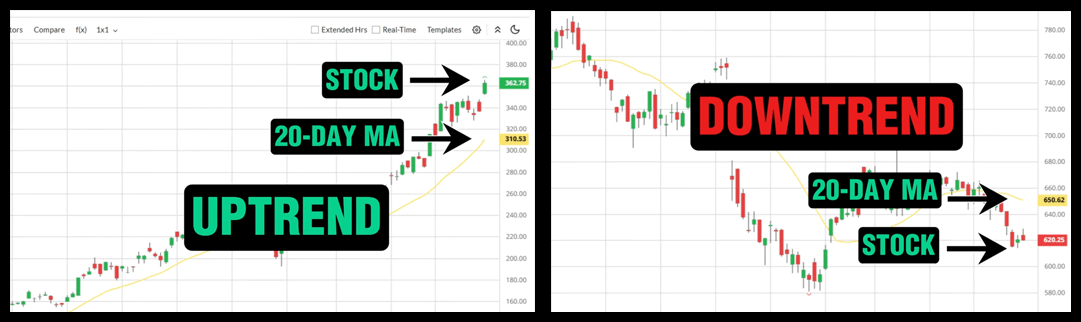
But how do you translate this? Well, it’s simple. If the stock is trading above its moving average, it usually signals an uptrend, and if it’s below, it can signal a downtrend. Traders use different trading periods or a combination of periods to spot trends over various time frames.
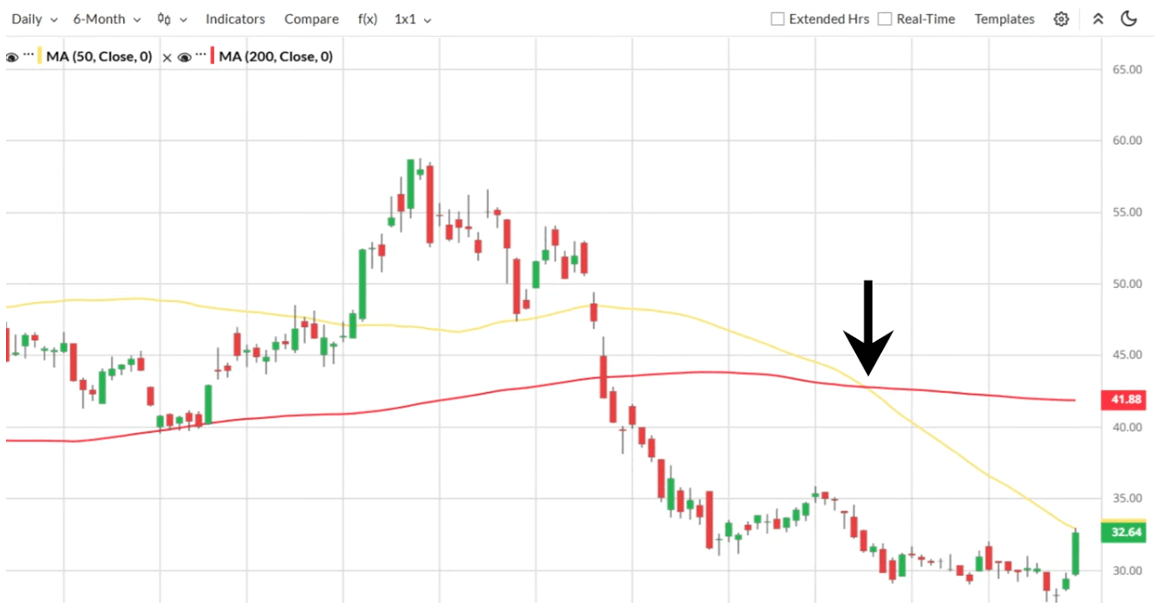
Of course, traders also look for crossovers, or when short-term averages cross above or below the longer-term ones. Generally, if a short-term moving average crosses above a long-term one, it’s bullish; if it crosses below, it’s bearish. Ever hear: The 50-day moving average just closed below the 200-day? Well, that’s exactly what I’m talking about - in this case, it would be a bearish movement.
Relative Strength Index (RSI)
Next up, we have RSI, or the Relative Strength Index. It’s a momentum indicator that measures how fast and how strongly a stock’s price has been moving across a given period, helping traders see whether it’s potentially overbought or oversold.
The momentum score is plotted on a 0-100 chart. Anything below 30 indicates the stock is oversold and may signal a bounce-back is coming. On the other hand, anything above 70 is overbought and may lead to a price correction.
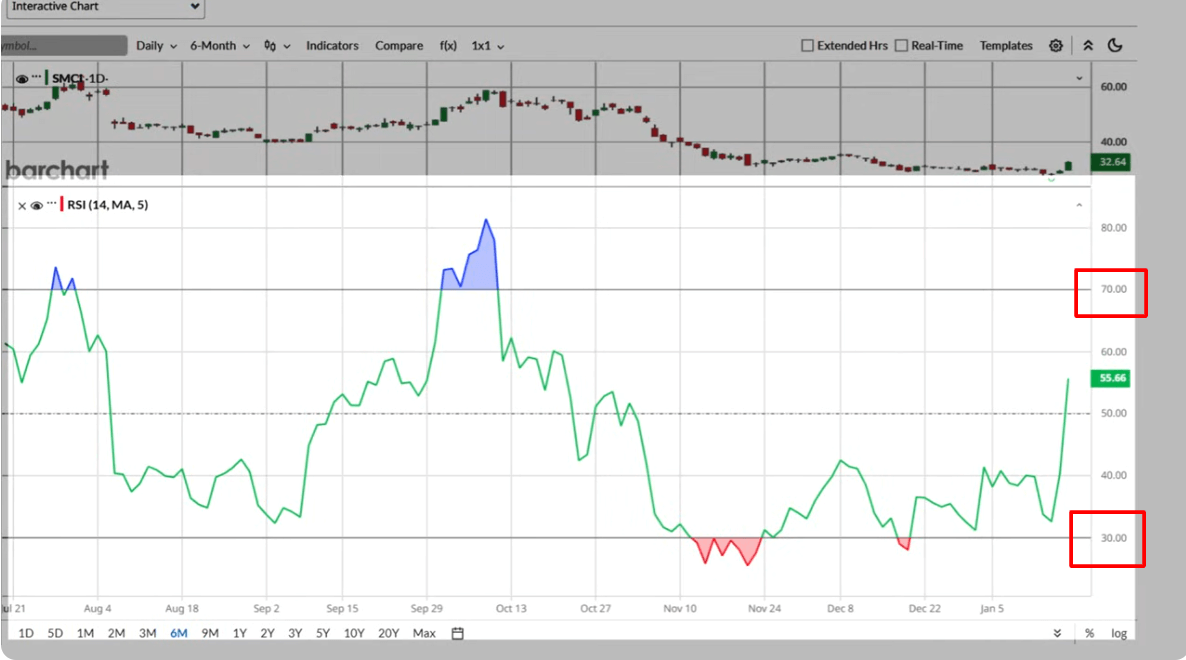
Options traders use RSI to gauge potential reversals and momentum shifts, helping them decide when to buy calls or puts, or when to sell premium based on overbought or oversold conditions.
MACD
Next, we have MACD, or the Moving Average Convergence Divergence. It’s a trend-following momentum indicator that shows the relationship between two moving averages of a stock’s price.
You can find MACD under the MACD Oscillator indicator.
MACD is made up of two lines: the MACD line, or the gray line in this case, which is the difference between a short-term and a long-term EMA, and the violet signal line, which is a smoothed average of the MACD line itself.
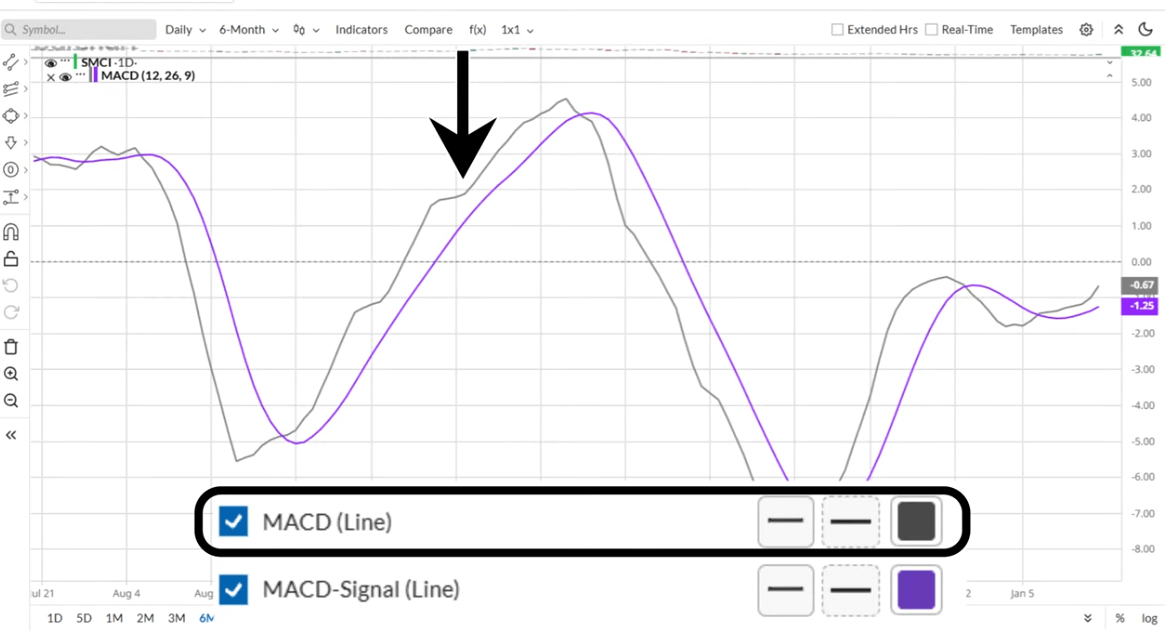
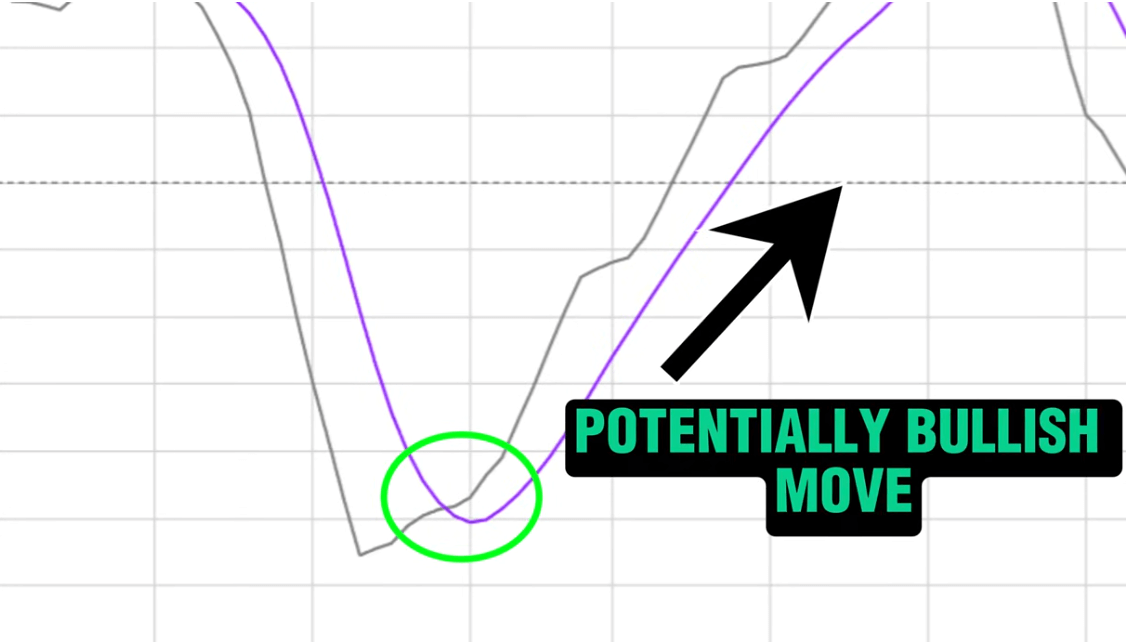
When the MACD line crosses above the signal line, it can signal a bullish move, and when it crosses below, it can signal a bearish move.
Options traders use MACD to time entries and exits, look for trend confirmations, or spot momentum changes that can indicate when to buy calls or puts, or when selling premium might be a better idea.
Bollinger Band
Next up, we have Bollinger Bands, a volatility indicator that helps traders see how stretched or compressed a stock’s price is compared to its recent average.
Bollinger Bands consist of three lines: a middle moving average, usually the 20-day SMA, and an upper and lower band set a certain number of standard deviations away from that average. When the price moves toward the upper band, the stock may be overbought, and when it moves toward the lower band, it may be oversold.
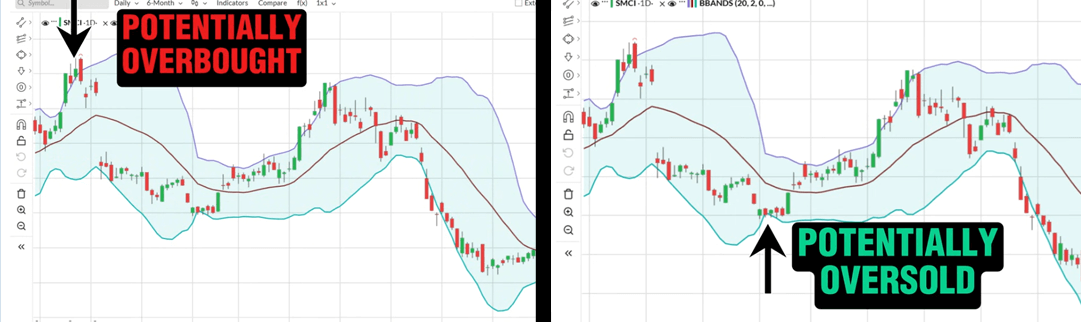
Options traders use Bollinger Bands to spot potential breakouts, reversals, or periods of high and low volatility, which can help decide when to buy calls or puts, or when selling premium might be more favorable.
How To Use Technical Analysis When Trading Options
Now, technical analysis tools can be used as is, but they do have their blind spots. The better way is to find a few technical analysis tools, maybe 2 or 3, that complement each other. I’ll give you a few examples here, and how you can apply them on Barchart’s Options Screener.
Moving Averages + Relative Strength Index (RSI)
Let’s start with one of the most popular. Moving Averages help define the overall trend, while RSI helps time entries within that trend.
Let me give you a few concrete examples. Let’s say you’re looking for a long call trade. First, jump over to the Long Call Options Screener found in the Options tab, then open the "Set Filters" tab. You’ll see the default filters and values right here, and you can change them if you want.
Now, we can use the RSI Rank filter. Then, I set the values for below 50% and NEW above 30%. This filters the stocks that are currently trading below 50% RSI, but have just recently moved above 30%. The results will be stocks that have recently been oversold but are now making their way up.
Then, you can add the overall buy, sell, or hold signal filter from Barchart’s Technical Opinion page. This filter consolidates 13 popular technical analysis tools, including several moving average periods, then suggests a rating. To get a buy rating, the majority of those indicators need to be signaling bullish momentum
You can adjust the time period for short-term or medium-term trading, depending on your preferred trading time frame.
If you’re bearish and looking for long puts, you can switch the Barchart Opinion indicators to sell and change RSI rank to above 70%, so you’ll spot stocks trading at overbought values. If nothing shows up, you can adjust the filter values as necessary, as long as you don’t go below 50% RSI.
And if you’re looking for more neutral or income-oriented option trades, you can focus on stocks with mixed or hold ratings and RSI values closer to 50%, which often point to consolidation phases ideal for selling premium strategies.
Moving Average + eMACD
Next, we have moving average and eMACD filter. This combo focuses on momentum shifts and potential reversals, giving traders a clearer picture than using either indicator alone.
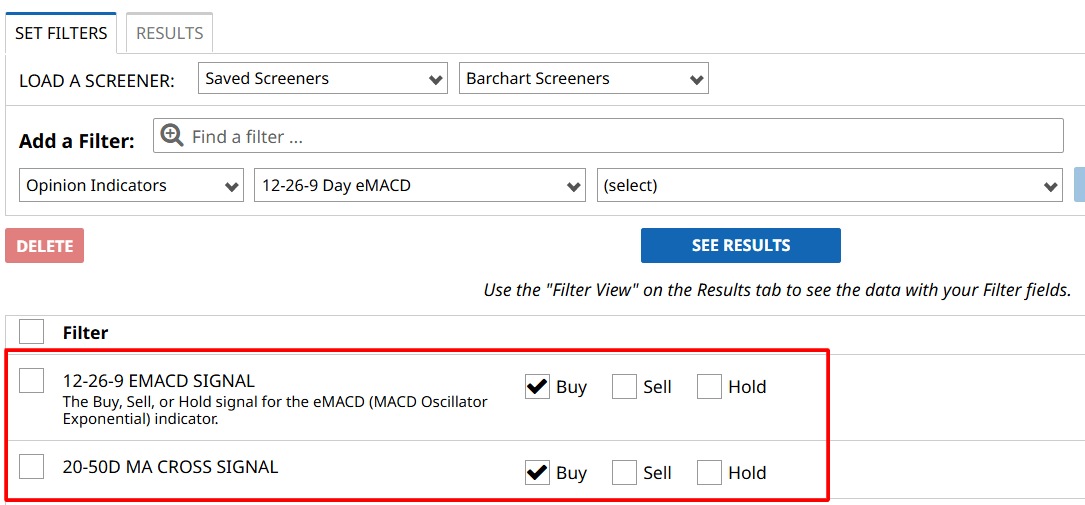
If you’re looking to buy calls for 30-60 DTE trades, for example, you can use the 20-50 day MA cross signal filter. This particular cross signal happens when the 20-day moving average crosses above or below the 50-day moving average, signaling a potential uptrend or downtrend.
So you can set it to a buy signal, then add the 12-26-9 EMACD Signal filter. This MACD filter uses the 12- and 26-day EMAs with a 9-day signal line to show momentum, so combining it with the 20-50 day MA cross helps confirm stronger trends for your 30–60 DTE call trades.
If you’re bearish, you can change the screener to your preferred options strategy, then flip both signals to sell.
Bollinger Bands + RSI
Next, we have Bollinger Bands combined with RSI, a setup that focuses on volatility and momentum together.
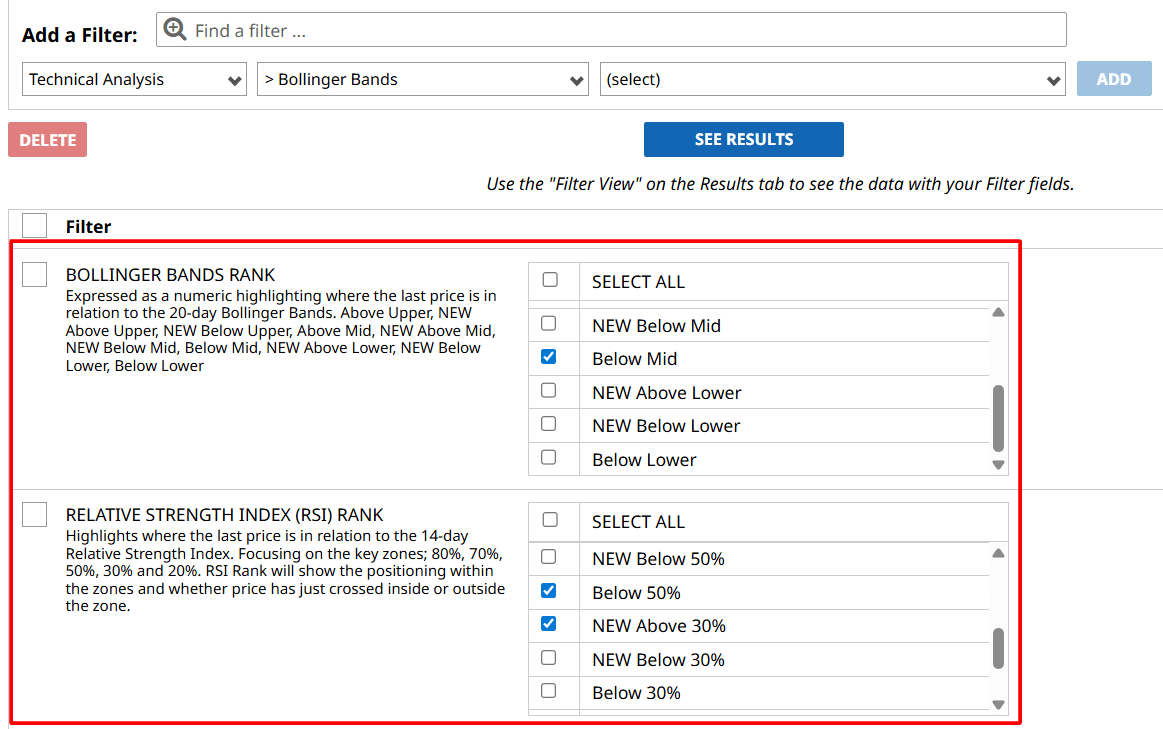
For bullish trades, you can add the RSI and Bollinger Band Rank or BBR filters. For RSI, set the filter below 50% and new above 30%. For BBR, set it below mid. This will give you stocks that have recently been oversold but are starting to show upward momentum, often bouncing off the lower Bollinger Band and making them potential candidates for bullish options trades.
For bearish trades, you can flip the RSI and Bollinger Band Rank filters. Set RSI above 50% and new below 70%, and BBR above mid. This will give you stocks that are showing signs of being overbought and losing momentum, and that could stall near the upper Bollinger Band. You can tighten or loosen the criteria as needed.
Why is RSI always here?
Now, you may be wondering, why am I always using RSI in the mix?
Well, most technical tools tell you the direction. RSI gives you a better idea about timing.
RSI adds context by measuring momentum strength and exhaustion, which helps traders avoid entering trades when the price is already stretched.
And where do prices get stretched? Above 70 and below 30 - the overbought and oversold zones. RSI gives you a timing edge, letting you see when a pullback or bounce is more likely, rather than just chasing a trend blindly. So these RSI combinations give you the direction, and if the trade is worth your time.
Risk Management When UsingTechnical Analysis for Options Trading
Now, before you head off to try those suggested setups, I need you to know something.
Technical analysis tools are not magic crystal balls. They can’t predict market movement with 100% accuracy. As they say, past performance isn’t indicative of the future. But, they can still be used as a guide to make informed decisions on the trades you want to take. But at the end of the day, the risks are still there.
That’s why you still need to manage your risks. Start with position sizing. Never risk more than a small percentage of your account on a single trade. Options can move fast, and one wrong move can take a big chunk out of your capital.
Knowing options trading - the strategies, the theories, and the metrics - like the back of your hand will help you become a better trader. If you’re new to this, we’ve got tons of videos on our YouTube channel and Barchart’s Options Learning Center for you to go through. There are also guides there on how to adjust your positions, should you need to.
Finally, don’t forget to diversify your strategy. This connects to knowing the different option trades you can use, in any market - because trading options isn’t limited to long and short calls and puts. If the situation calls for it, mixing long calls and puts with spreads or premium-selling trades reduces exposure to any single position and smooths out overall risk. Barchart offers a variety of filters and screeners for almost all option strategies out there, all with pre-set default filters that give you a number of balanced options trades.
Conclusion
Technical analysis can be a powerful tool in options trading, particularly for anticipating potential price moves. That said, no one metric is 100% accurate, and it doesn’t replace traditional option metrics like implied volatility and the Greeks. But when used as part of a well-defined trading plan that includes risk management, technical analysis can give traders the best chance to succeed.
If you want to test it out, I suggest starting small. Use a paper trading account, keep a trading journal, track your trades, and monitor the results. Over time, you’ll get a feel for what works best for your trading style and timeframes. Trade smart, manage your risk, and let the charts guide you. But always remember, you control the trade, not the other way around.