Selling Options Feels Safer... Until One Trade Wipes You Out
You’ve probably heard that selling options is safer because it wins more often, right?
But here’s the real question, and think about this carefully. What are you really risking when selling options?
I’m asking because many new traders fall into the exact same trap.
That’s why today, I’ll show you a quick but very real example: how one bad trade can blow up an account.
And of course, I won’t stop there. I’ll show you how to use tried-and-tested risk management techniques for different trades and outlooks, and the tools you can use to help you make better trading decisions.
So let’s start with the most basic distinction that changes everything. Buying versus selling options.
Buying Vs. Selling
I’m sure you’ve heard what options are, but in case you haven’t, they offer the right but not the obligation to buy or sell an asset at the set strike price on or before the expiration date.
And that definition sounds clean and simple. But the risk behind it is very different depending on which side you’re on.
When you buy options, your risk is fixed. You pay a premium, and that’s it. So you can be wrong, even very wrong, and you still know the worst-case outcome going in.
Let me give you an example with the SPY. At the time of recording, the ETF is trading at $686. Say you buy an at-the-money $686 strike call on it for $15 per share or $1,500 per contract.
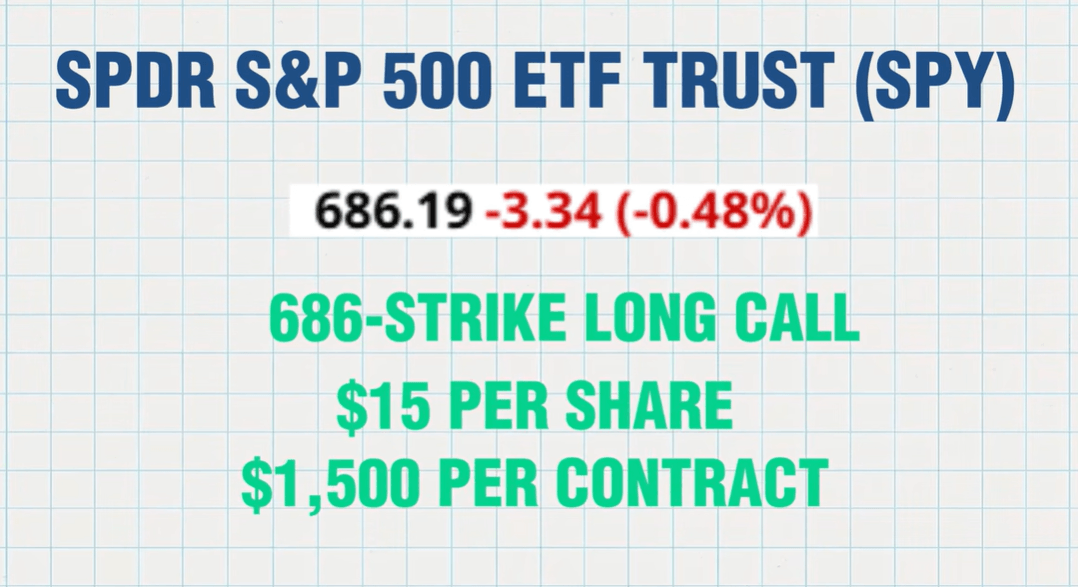
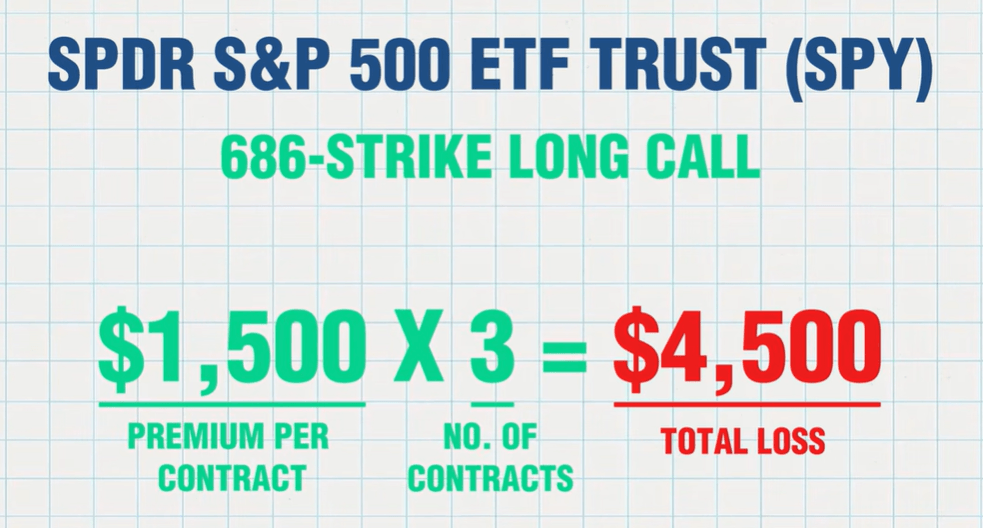
If you’re wrong and the ETF trades below the strike at expiration, that $1,500 is gone. If you buy 3 and you’re wrong, that’s $4,500. It’s uncomfortable, and it hurts, but it’s contained.
But when you sell options, the risk is much greater. Now you’re collecting a small premium upfront, but the potential loss can be much larger. Sometimes it’s unlimited.
For example, naked calls have theoretically unlimited losses. And even cash-secured puts can sting if you sell too many.
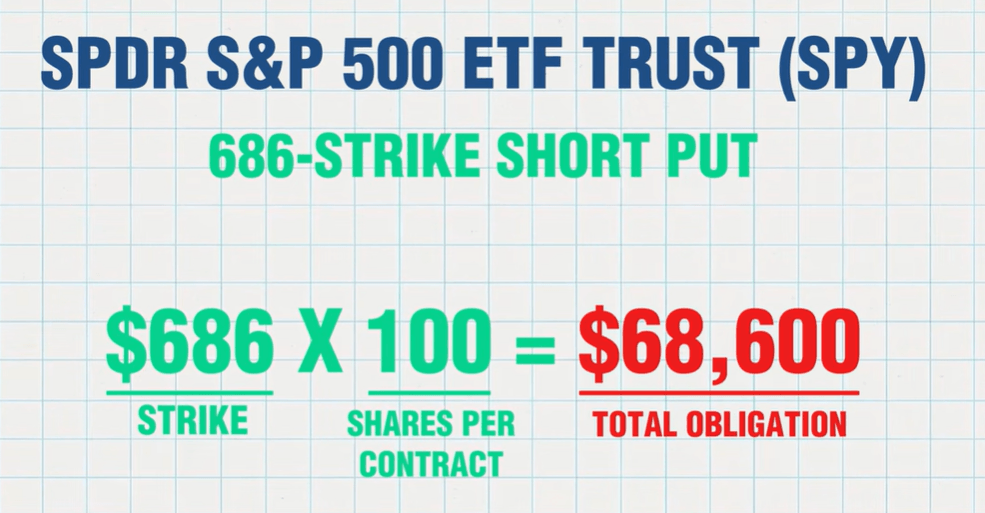
Let me give you an example. If you were short a put on the SPY at the $686 strike, you’d collect $10.73 per contract, or $1,073. If everything goes well, the option expires worthless, and you keep the premium. But if the trade goes south, and you get assigned, you’ll be buying $68,600 worth of the SPY.
But if you’d sold three of those and got assigned? That’s more than $200k.
Now, it’s not too bad if you really wanted to own the stock or ETF at that price, but what if the SPY fell to $600 when you got assigned?
That means you just got into a position that’s already in the red.
So, yes, time decay works in the seller’s favor- but leverage works against you.
This is where a big misconception shows up.
When selling options, high win rates feel safe. But a high win rate doesn’t mean that you’re risking small amounts. It just means the losses are hidden, until they’re not.
And because sellers take asymmetric risk, sizing isn’t optional.
Another thing most traders miss here is correlation. You can size each trade “correctly” and still be massively overexposed if all your trades rely on the same market segment.
Five bullish short puts on similar AI stocks are not five different bets. They’re one bet in disguise.
Position Sizing
For that reason, we need to think about position sizing. This is how much at risk in a single trade. Not which stock or option you pick, but how big the bet is.
And position sizing matters more to long-term results than picking the “right” trade. That’s because you can be right on the direction and still end up at a loss, sometimes a very big loss if the positioning is too large. You can also be wrong plenty of times and end up just fine as long as your position sizes are controlled.
What do I mean by that?
Short Put & Credit Spreads
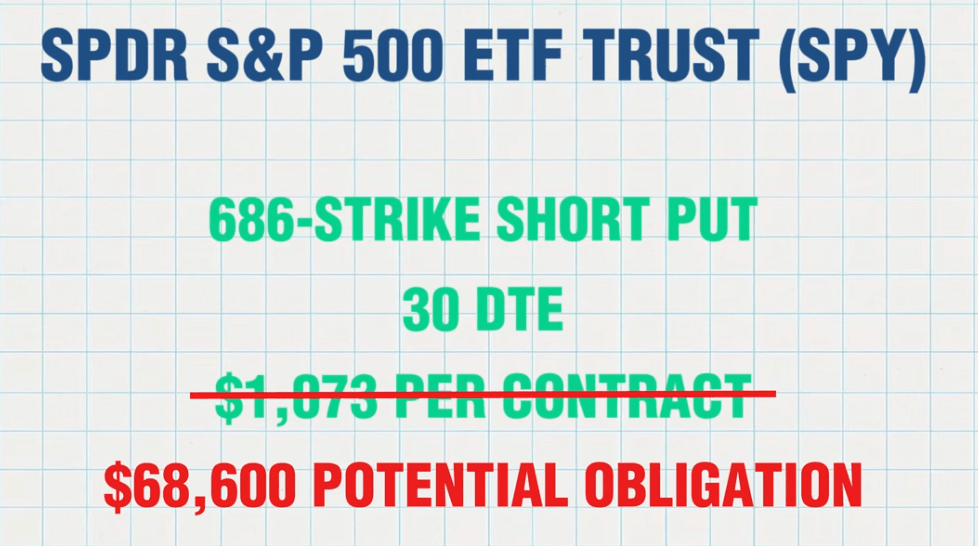
Well, let’s take that previous SPY short put again as an example with the $686 strike price, 30-day expiration, and $1,073 premium per contract.
Now here’s the problem: most new option sellers don’t usually think in terms of exposure. They think in terms of premium collected. That’s a fatal mistake.
See, it’s not a thousand-dollar position. That’s a sixty-eight thousand-dollar potential obligation.
And if you had $100,000 in your account? Well, you’re essentially risking nearly 70% of your cash on that trade alone.This is why position sizing should always start with knowing the maximum loss, not the probability of profit.
Now, a common rule the institutional traders follow is to risk no more than 1-2% of their portfolio per trade.
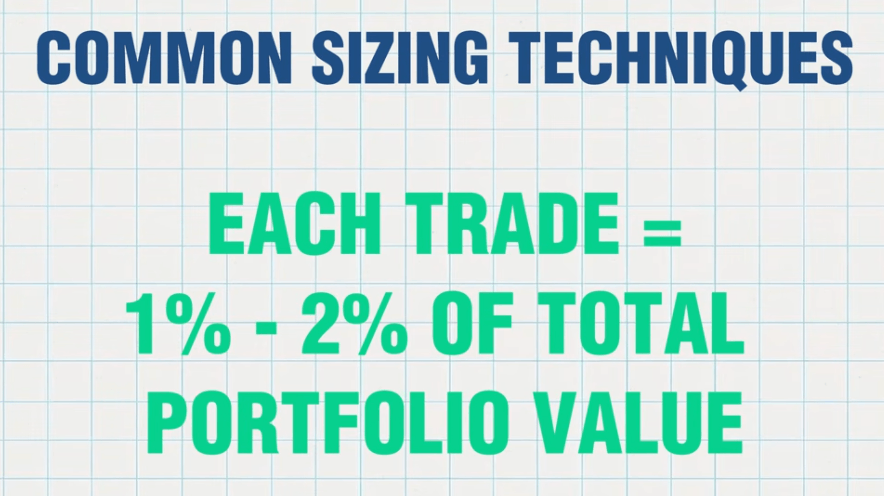
Personally, if I’m more bullish on the trade, maybe I’ll go as high 5% or even 10% on a very rare occasion.
But remember, what happens if things go bad? That’s why proper position sizing will make or break your account.
It’s the same for other credit spreads. Look at the maximum loss, compare it to what you have in your account, and decide if it’s wise to take that bet. And this decision should happen before you enter the trade, not after it moves against you. Every short option trade should be opened with a clear plan for what you will do if you get assigned.
Now, calculating the maximum potential loss for credit spreads is easy, and I talk a lot about them in this video right here. But you know what’s easier? Using Barchart’s Option Screener. You can see the max loss, along with a bunch of other important metrics, like liquidity and open interest.
No need for Excel or your calculator app, no need for guesswork. All actionable data points are available.
Short Call (Covered)
Now, how would that look when you’re selling covered calls, for example?
Say you have 500 shares of Apple and you want to earn a premium while you keep them for the long term.
Now, what inexperienced traders will usually do is sell 5 calls on Apple, which equals 500 full shares, on one strike price, say $300, and expiration date, let’s say, on March 6.
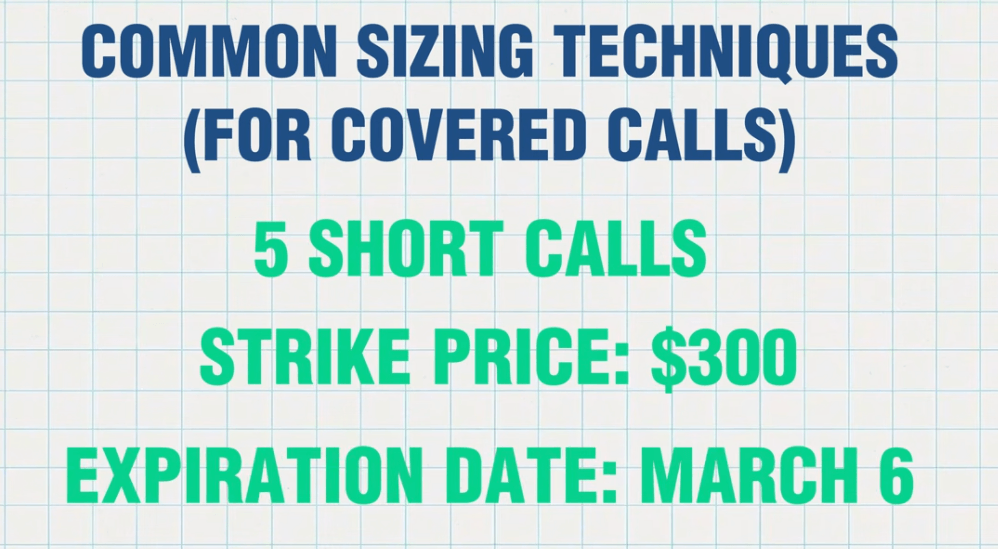
So, March 6 comes around, and Apple is now trading at $305. Your 5 calls are all in the money, and there go all your shares.
But what if you structured it differently? What if instead of one trade, you laddered your 500 shares across 3 or 5 different strike prices, each higher than the last?
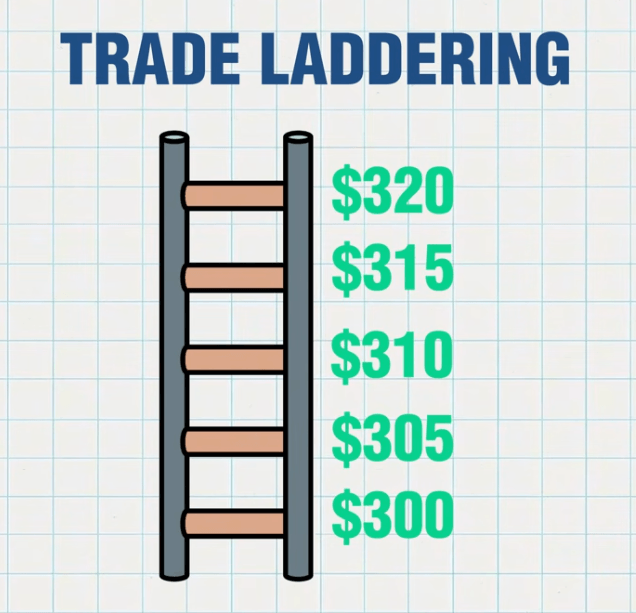
Or maybe you sold them all at the same strike price but at different expiration dates?
That way, if you get assigned on one, you still get to keep the rest, and you’ll have time to assess if you want to continue risking your shares for assignment or just buy to close your position.
This is where position sizing reduces the risk of being forced into a single all-or-nothing outcome.
Reducing Your Cost Basis
And since we’re talking about income strategies, let’s consider how selling options can reduce your cost basis.
Let’s say that you want to buy 100 Apple shares at some point. But you think Apple is a bit expensive right now, it’s currently trading at $276. So you decide to sell a cash-secured put. This strategy allows you to get paid to wait for the stock to potentially trade below a specific price.
So, let’s say you’d be happy to buy 100 shares of Apple for $260 each. The best way to do this is to sell a 260-strike put on Apple, say in the next 30 days, so you can maximize the time value.
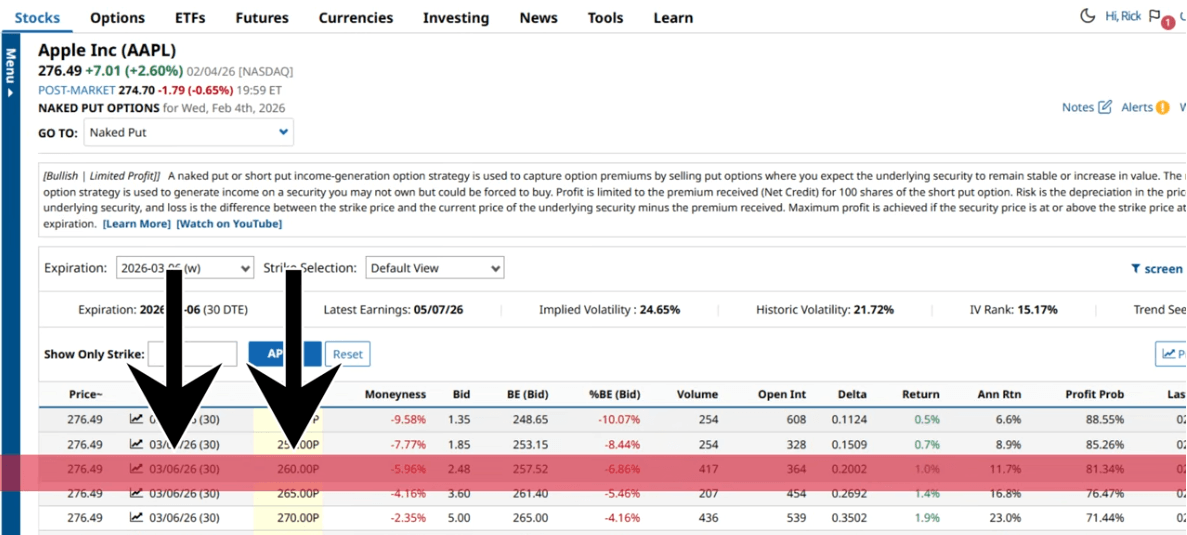
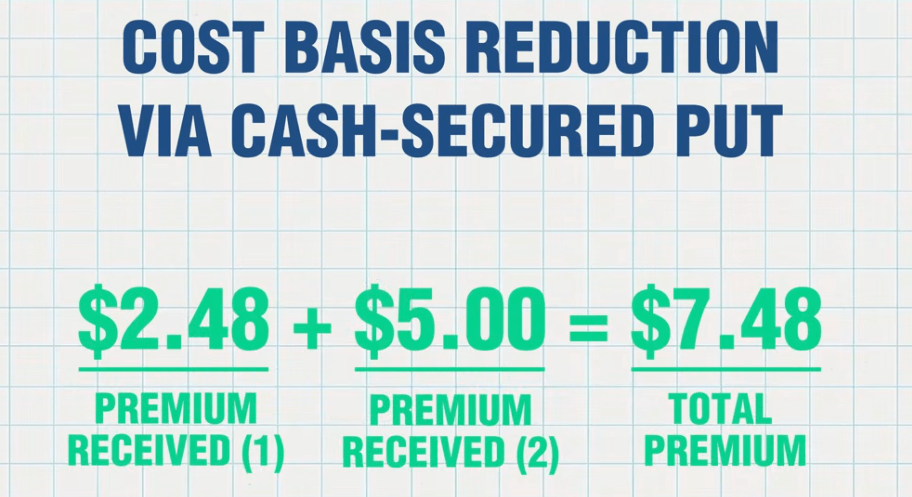
As you can see here, 260-strike puts are trading at $2.48 per share. So if you sold the 260-strike put and got assigned, your cost basis for those Apple shares is $260 minus $2.48, making it $257.52.
But let’s say 30 days pass, and the put expires worthless. In fact, Apple goes to $300.
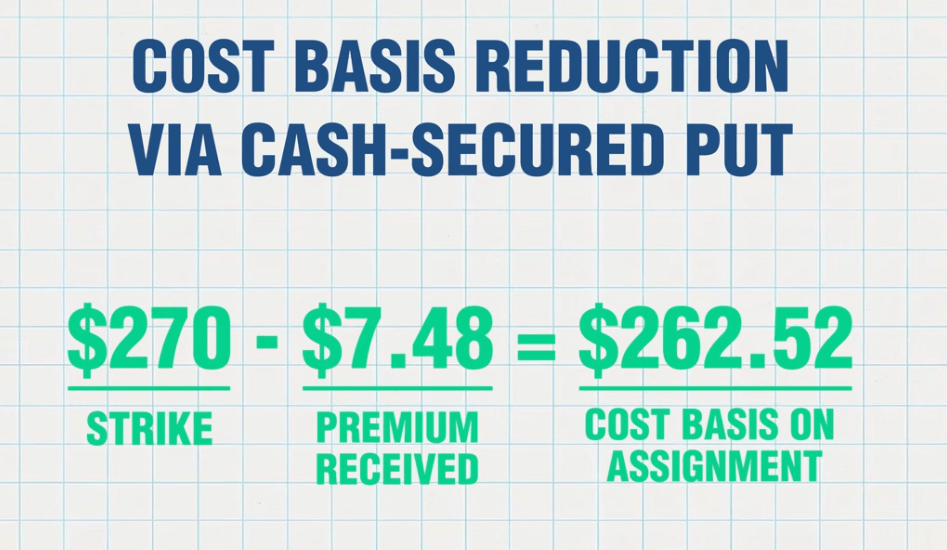
Well, you sell another put, but this time you sell the $270 strike and collect $5 a share this time. That means you’ve collected $7.48 in total premium across two trade cycles, without owning a single share. That’s the power of stacking premiums over time.
So let’s say you do get assigned this time for $270. Your cost basis is now $262.52, which is much closer to your original preferred price.
Imagine if you could have done that for a full year, then you could be sitting on thousands of dollars in collected premiums, all while patiently waiting for the right entry point.
And at the end, when you do get assigned and finally get the stock you wanted, your cost basis could be a fraction of what it would have been if you just bought the stock outright.
Instead of chasing the price with limit orders or good-till-cancelled orders or trying to time the perfect dip, you got paid to wait.
But here’s the warning most people skip. Lowering your cost basis doesn’t make a bad stock a good investment. That’s because premiums only help if the underlying is still something you want to own long term. So, your choice of company will always matter here.
Rolling Your Trades
Now, let’s flip the situation back to selling covered calls.
You sold a 300-strike Apple call for $2 per share, but then Apple’s price kept rising. The stock pushed through $300 and is now at $305, with just 5 days to expiration.
Now you’re in a bit of a pickle. You can let the shares get called away and lock in your gains, or you can roll the calls.
Rolling your trades means simply buying back your existing contracts and selling new ones with a later expiration, a higher strike, or both. The goal is to give the trade more time to work in your favor.
Here’s the thing, though: rolling isn’t about “saving” a bad trade. It’s about managing a good one.
And remember, adjusting trades should be a tactical decision, not a knee-jerk reaction.
This is mostly because rolling often comes with higher premiums due to increased time value, or volatility, or the simple fact that the stock is now closer to, or in the money.
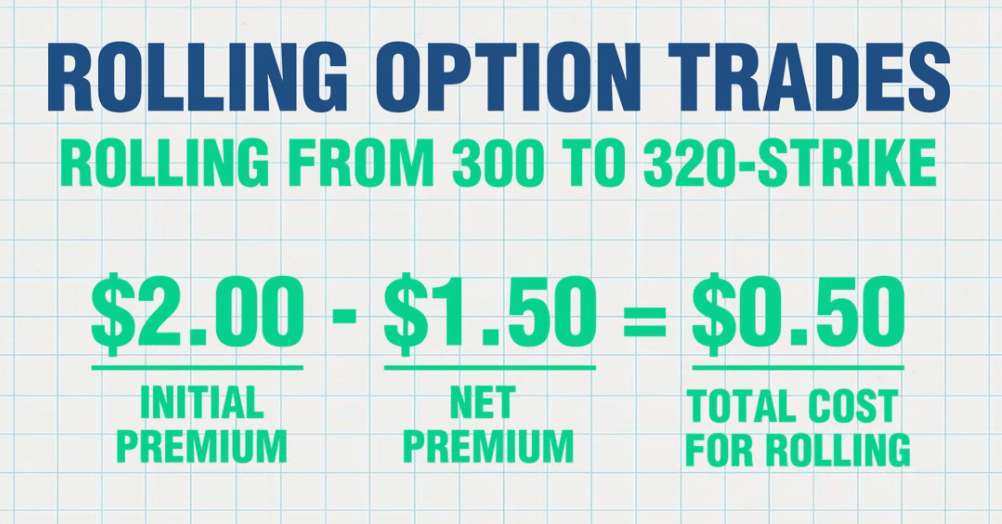
Let’s say you roll those $300 calls to the $320 strike. To buy-to-close that 300-strike call, now you might need to pay $4. That’s a $2 debit.
But then, you receive $3.50 for the new 320-strike short call.
So, instead of pocketing the initial $2 premium from that old, unrolled 300-strike call, you now have $1.50 instead.
That 50-cent difference buys you time, flexibility, and more potential upside.
If Apple stays below $320 at expiration, you keep the $1.50 and still own your shares, which you can use to sell new covered calls.
If it breaks above $320 and you choose not to roll again, your shares get called away at $320, and you call it a day.
Of course, you’ll always want to consider position sizing when rolling your options. Most of the time, the best adjustment strategy is to do nothing at all.
Regardless, rolling your trades works well for selling options, such as covered calls, cash-secured puts, and even credit spreads. You get to defer the assignment, giving you time for the stock to move in your favor while continuing to collect premium.
Conclusion
Position sizing, correlation awareness, liquidity, and exit rules matter more than the strategy or the underlying itself.
If you manage the position size first, plan for assignment before entry, and treat premium as a tool rather than free money, you give yourself something retail traders almost never get: survival. That’s because in the long run, staying in the market is the goal.
Barchart’s Option Screener and entire platform can help you find the best trades, as well as high probability entry and exit points. If you’re still new to options trading, paper or practice accounts allow you to test strategies without the risk of losing cold, hard cash. And the time you took to read this wasn’t wasted, because knowing what to do and what to look out for is going to matter so much more when real money is on the line.