How to Trade Options During Earnings Season
It’s that time of the year again. No, not Halloween, or Thanksgiving, or the long run-up to Christmas. And no, definitely not Black Friday.
It’s earnings season. Once every three months, publicly traded companies pull back the curtains to reveal how they’ve been doing in the last quarter. Top line, bottom line, backlog, it’s all there, posted online and plastered all over Wall Street.
And for those not really familiar with financials, I understand how those rows and rows of pure numbers can seem a bit - dry.
But it doesn’t have to be. The smart money knows that the earnings season is when markets move, with some stocks soaring or crashing overnight on the weight of a few line items in their reports. That’s predictable volatility right there - and when you’re trading options, you know there’s money to be had during earnings seasons.
But how do you trade options around earnings season? And what metrics do you need to look out for when you get started?
Financials Intro
Earnings season is a period when publicly listed companies are required to release their quarterly results. They fall roughly a few weeks after each fiscal quarter ends, so that’s usually January to February, April to May, July to August, and October to November.
Now, earnings reports come in several versions. The first is Form 10-Q, which the company is required to submit to the Securities and Exchange Commission. That report contains detailed income statements, where you’ll see the total revenue, operating expenses, profit, net income, and more - for the quarter. There’s also the 10-K which is the annual report- and its a bit more comprehensive.
Either way, both forms include the balance sheet, where you’ll find snapshots of what the company owns and owes, and a cash flow statement, which tracks how much money is actually moving in and out of operations.
Then, the company sends out a press release, which covers most of the important information for the quarter, and a separate presentation, often called an earnings deck, that provides more detailed charts, graphs, and commentary on performance, trends, and future guidance.
Then, there’s the actual earnings call, where company executives discuss the results live with analysts and investors.
Now, reading financial statements is a skill of its own.
But regardless of what form you look at, what really matters is how those numbers compare to what the market was expecting.
Expected Move and Average Earnings Move
Not sure what I mean? Have you ever heard or read statements like “the company beat expectations” or “missed earnings” and saw the stock move according to those observations? That’s because expectations are the barometer by which financial results are measured.
The problem is, there’s really no way to predict the financial results of a company until the release. The good news is that historical data can help you make an informed decision.
This is where expected move comes in.
Expected move predicts a range where the stock is expected to trade on a certain date. This is calculated by taking 85% of at-the-money straddle premiums. In English? It gives traders a probable high and low range for the stock’s price, and that helps them make better trades as they don’t have to gamble.
Expected move can be found in all Barchart Screeners or right off the stock’s profile page. Look for "Expected Move" in the left navigation bar.
But of course, earnings seasons are special, so wouldn’t it be better if you could have historical records of the stock’s movement during these times? Good thing Barchart also has the Average Earnings Move, which, as it says in the name, gives you the average price movement in the last four earnings releases.
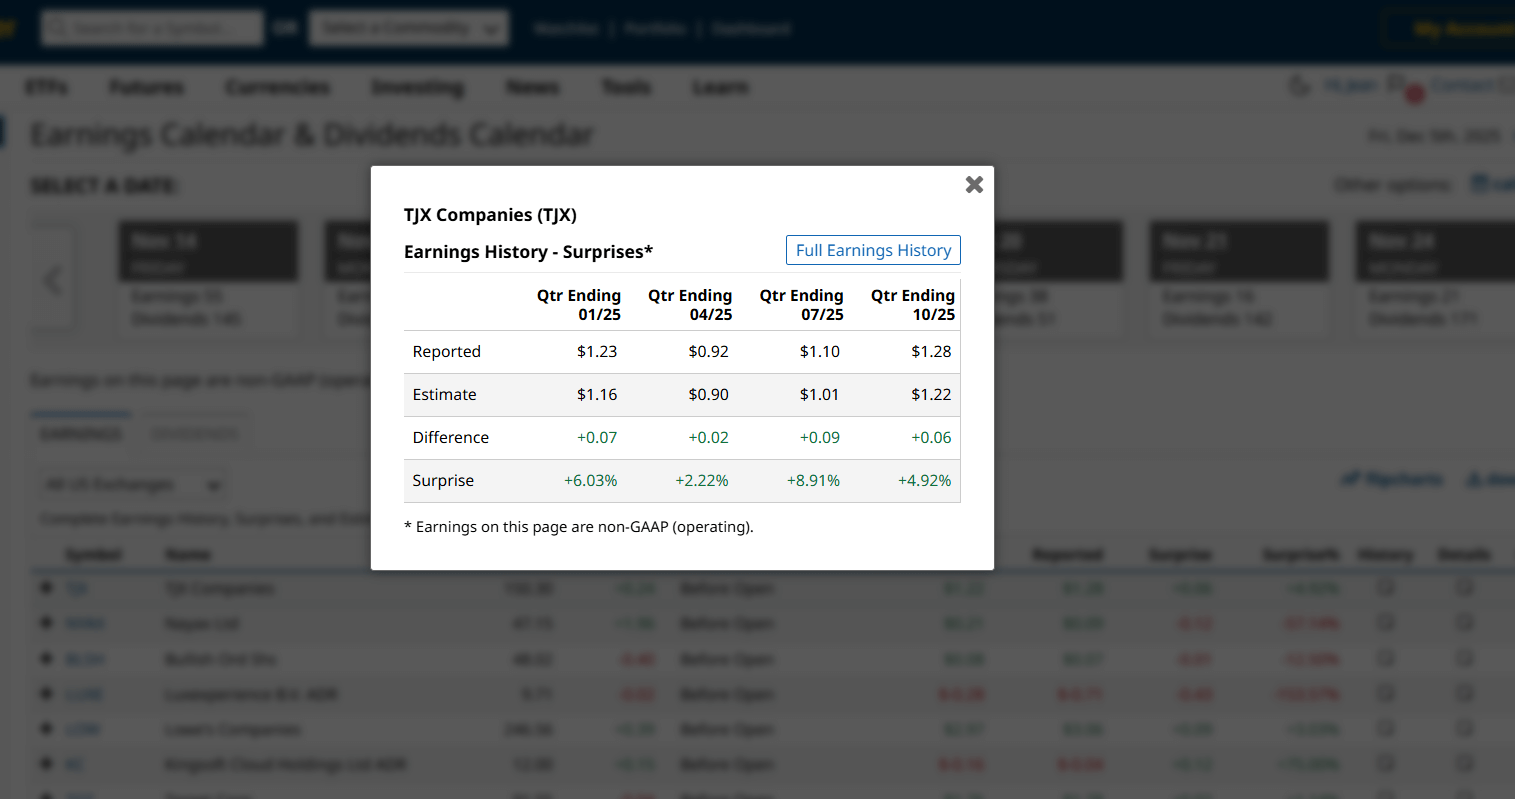
Let’s test it out. Nvidia will be releasing its 2026 fiscal second-quarter financials on November 19, a few days away from the time of writing. By the way, you can check out earning schedules on Barchart on the Earnings and Dividend page, and you can set alerts for specific companies by clicking the three dots in the Links column at the end.
You can also see both the earnings estimates and history by clicking the icon under the details and history column, as you can see right here.
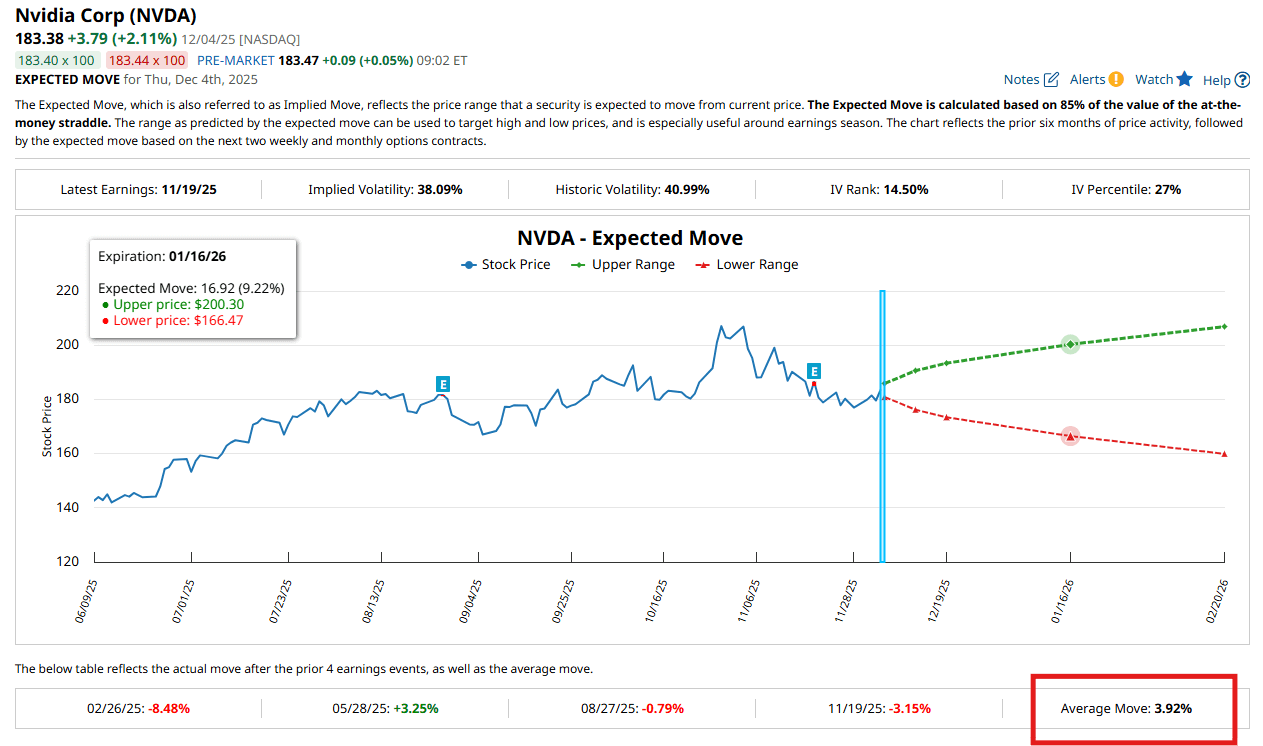
Now, let’s jump to Nvidia’s profile page and go to the Expected Move page, and we can see the chart that includes the stock’s price movement in the last six months and is followed by the Expected Move prices based on the next two weekly and monthly options contracts.
You can also see the average earnings move, and down below is the table that shows you the expected move percentage, ranges, and implied volatility for different expiration dates, plus the open interest for each.
Volatility is a measure of how much and how quickly a stock’s price can move over time. Now, there’s two types of volatility: implied volatility or IV, which is future-facing, and historical volatility or HV, which is in the past. If you want to know more about volatility, I released a deep dive video on it here.
Now, open interest tells you the total number of open option contracts for that particular underlying, premium, and expiration date. The higher the open interest, the higher the liquidity, which makes it easier to enter and exit trades.
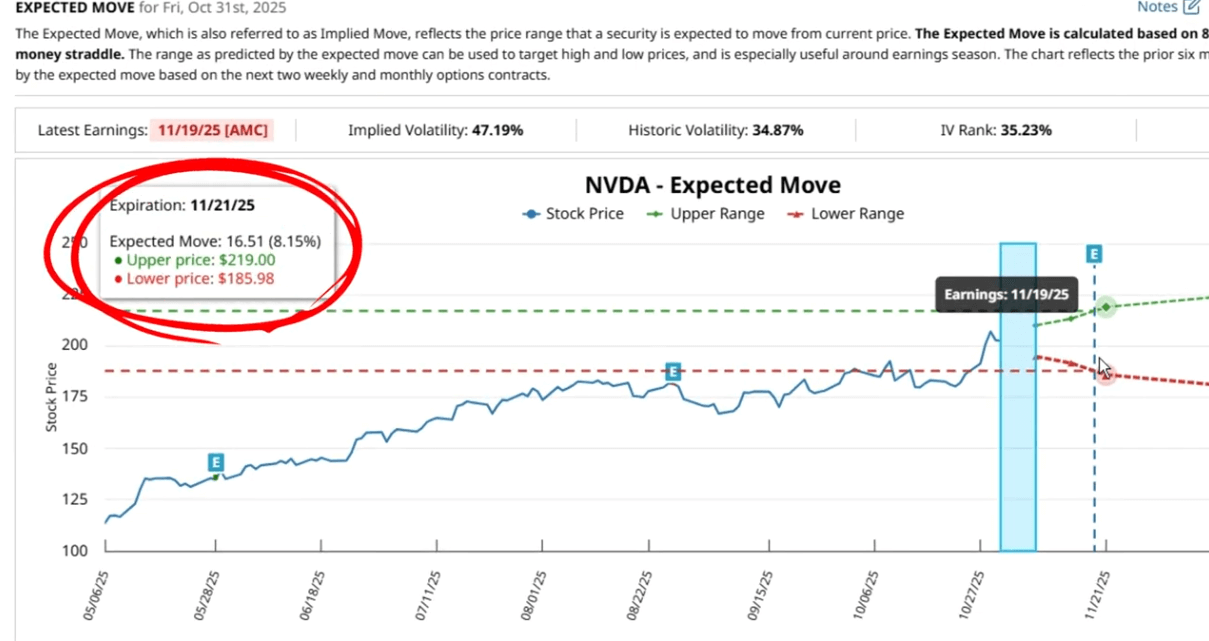
According to the data, Nvidia has moved by a little over 3% in its last financial releases. It is expected to trade between $186 and $219, a range of approximately 8%, on the expiration date closest to its November 19 financials release date.
Trade Samples
So how do you play this? Here are a few specific examples, which we’ll get from the NVDA Covered Call Screener.
Since the upper expected trading range is $219, you might be interested in selling a 225-strike covered call on Nvidia, if you own 100 shares of the stock. A covered call means selling a call option on stocks you already own. And the goal is for the stock to trade below your strike price at the contracts expiration, so it expires worthless - and you can keep the entire premium. By the way, I cover that topic in this video.
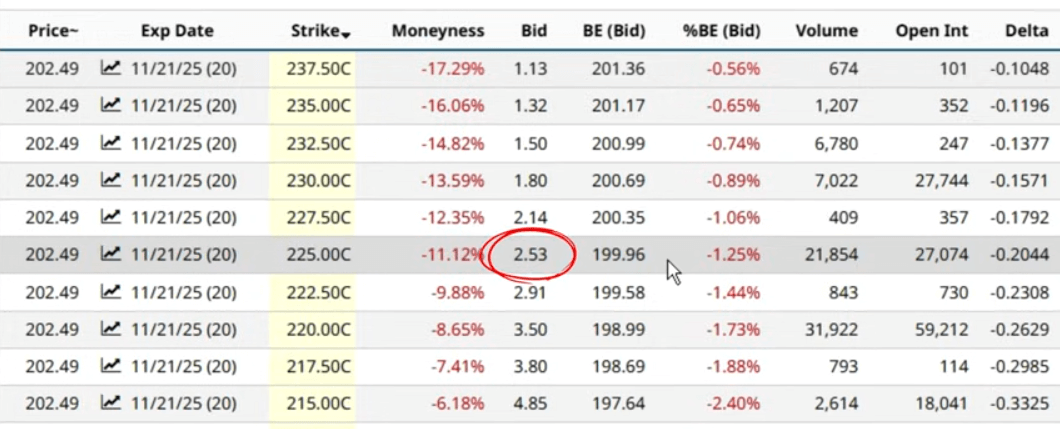
Now, for this trade example, you’d get $2.53 per share or $253 total for the contract. In this trade, you at least have some measure of security since you set your strike price above the expected range.
But what if you don’t own Nvidia right now, but would want to? You can, instead, sell a cash-secured put. A cash-secured put is an options strategy that involves selling a put option on an underlying asset. You’ll earn a premium while setting aside enough capital to buy the shares should you get assigned. If the stock trades above your strike price, you keep the premium and nothing else happens, But, if the stock trades below your strike price at expiration, you get to buy 100 shares at a discount relative to what it’s currently trading at- and you got paid to do it. If that sounds good, I covered cash-secured puts extensively in this video.
For now, let’s jump over to the NVDA Naked Puts screener, then maybe you can sell a 185-strike put for $3.25 or $325 total. If Nvidia stays above your strike at expiration, you get to keep the whole premium, but if it falls below that, you buy 100 shares for $185 each, which is a nice discount compared to its current price, $202.
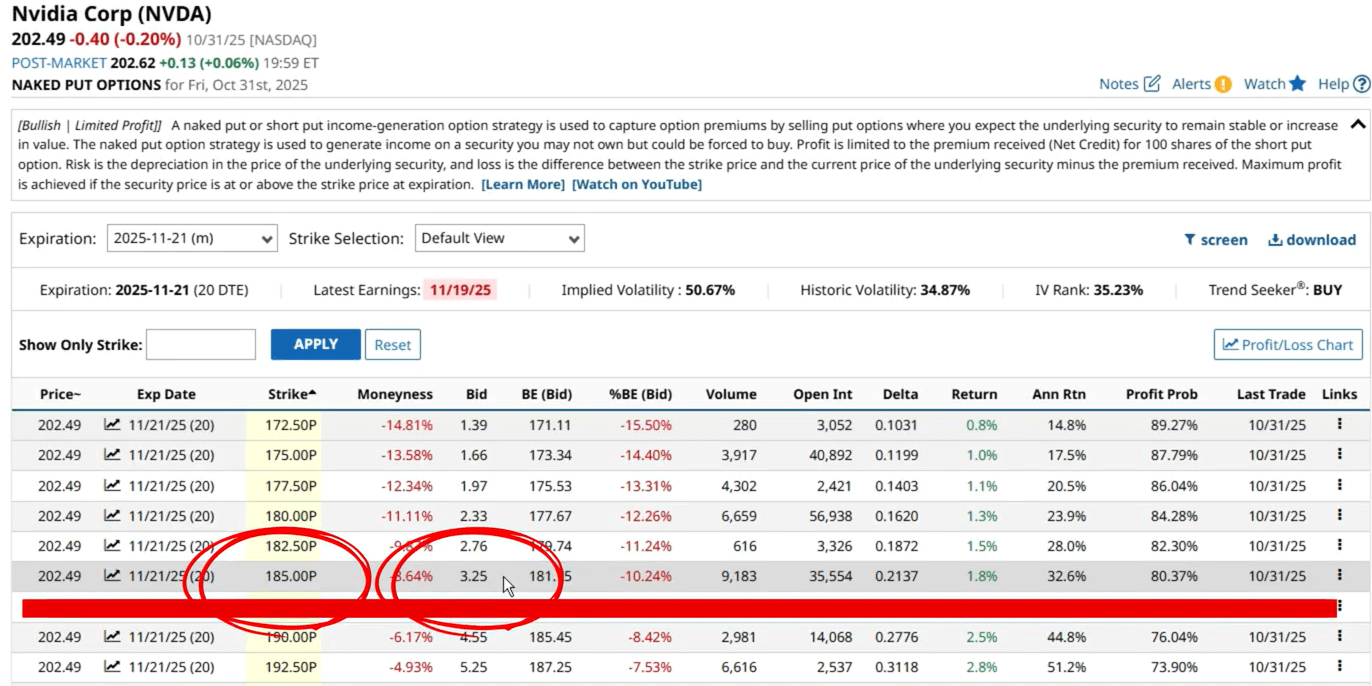
One thing, though, about selling puts: you need to put yourself in the mindset that you have already committed to buy. Because assignment is automatic. No one calls you and asks if you still want to buy or not.
Trades with smaller accounts
Now, both these trades, covered calls and cash-secured puts, require you to have a considerable amount of cash or investments already in your brokerage account. But what if you have a small account and can’t buy 100 shares of a specific security?
Well, you can instead sell a spread. A spread sets a “floor” on your trade. It protects you from a larger loss. Some common spreads include Bear Calls and Bull Puts.
With a Bear Call, or a call credit spread, you sell a call option on an underlying stock, and then buy another call option on the same underlying stock and expiration date, but at a higher strike price. The goal of the Bear Call is for the underlying stock to trade below the short call strike at expiration. And if that happens, you keep the net credit. Otherwise, the trade ends at a loss.
Then you have the Bull Put spread. It’s like a Bear Call, but it works the other way around. The goal of a Bull Put spread is for the underlying's price to stay above the short put’s strike price at expiration.
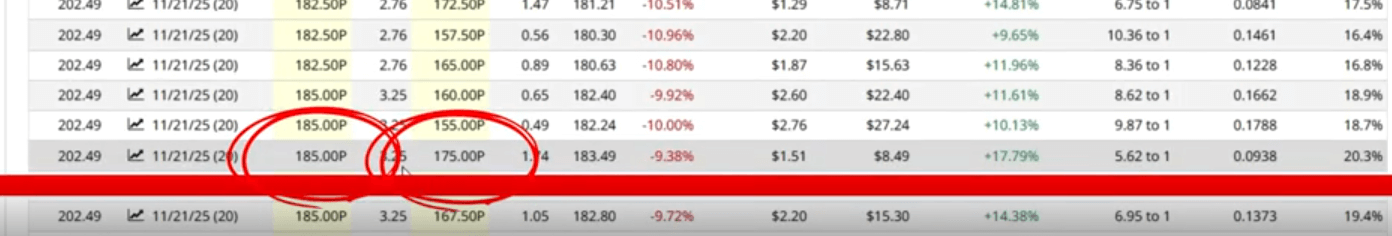
Let’s have a look - and we can start by checking out the NVDA Bull Put Spread screener, in Vertical Spreads, and you’ll get the suggested trades. Remember, you want the stock to trade above the above short strike at expiration. So here’s a sample 185-175 bull put spread that you can sell, for which you’d get $1.51 per share or $151 per contract. The trade has a maximum potential loss of $849 per contract and a roughly 20% chance of ending at a loss.
And you can apply these numbers to other strategies like condors, butterflies, straddles, and strangles.
Using Volatility During Earnings
Now, you might be wondering why most of the samples I provided earlier are for selling options. There’s a good reason for that. You see, in the run-up before major market events like earnings announcements, implied volatility or IV is typically elevated. With higher IV comes higher premiums, which favors option sellers.
However, when the major event is over, IV usually drops. This event is known as an IV crush. An IV crush usually leads to options premiums dropping sharply, even if the stock itself doesn’t move too much.
Think of option premiums as a balloon, and as earnings season draws near, the sheer number of traders speculating on the results causes the balloon to fill up with air, which represents volatility. After earnings are released, the air is let out, and so the premiums shrivel up.
So, lower premiums after the volatility crush mean options are less valuable, and therefore less likely to be exercised, which, again, favors the sellers.
However, you can’t just assume that volatility is high for a particular stock during earnings season. You need a way to check - which Barchart gives you!
So, going back to the bull put screener, let’s check volatility metrics by clicking the profit/loss chart, then going to the volatility tab.
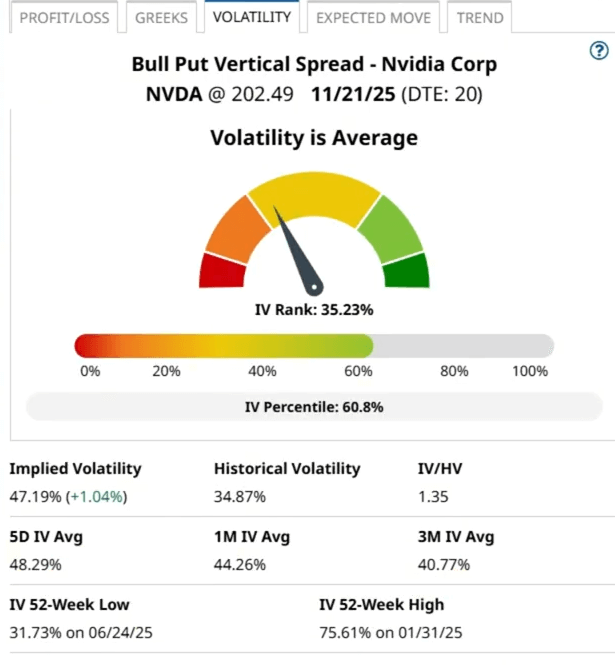
And you’ll see implied volatility and historical volatility. There’s also IV rank, which measures the current IV's position compared to the past year, or more specifically, where it sits in the range, and IV percentile, which tells you how often IV has been lower than its current value over the past year.
You can also see other values like 5-day, 1-month, and 3-month average volatility, and the lowest and highest volatility values in the past 52 weeks.
But, the best features of the volatility tab, I think, are the interpretations.
Interpretations can go from Very Low to Very High. It can also show if there’s notable movement in volatility, whether it’s rising or falling. If the 5-day average IV is at least 5% lower than the 20-day average, the implied volatility over historical volatility ratio is below 0.91, and IV is falling, it signals a decline in volatility.
On the other hand, if the 5-day average IV is 5% higher than the 20-day average, and the IV/HV ratio is above 1.09 with a rising trend, volatility is increasing.
Overall, higher but falling IV usually works best for short option strategies like covered calls, cash-secured puts, or credit spreads... that means IV, rank, and percentile above 60 or 70%, as these trade setups have the potential for richer premiums, and the falling IV will eat away at the options' values, allowing you to buy them cheap or let them expire worthless.
On the other hand, buying options contracts is best done when volatility is low but rising. Perhaps when IV, IV rank, and IV percentile are all below 50% but with an upward bias.
Right now, Nvidia’s implied volatility is 47%, while its historical volatility is 35%. That means the market expects more movement ahead than we’ve recently seen. Its IV Rank of 35% is roughly average, while an IV Percentile of 60% shows that current implied volatility is higher than it’s been about 60% of the time over the past year.
So, overall, this suggests moderate but rising market anticipation ahead of Nvidia’s earnings, which could lead to higher premiums in the next few days, if the pattern holds. So, selling options is going to look more appealing.
Final Thoughts
Focusing more on available data when trading around earnings seasons can be a good way to boost your win rates. However, you do need to remember that no metric can predict the future with 100% accuracy. That’s why you still need to keep an eye on your trades, monitor your positions, look for any major news, and, of course, check out the earnings when they become available.