My Go-To Cash Secured Put Screener for Consistent Income
Cash-secured puts are one of my favorite income-generating strategies. I’ve made a few videos about it, covering everything from setup and trade management to the risks you may face when selling them. And I’m not alone. Many creators have covered the same topics as I have, like what underlying stocks to use, what platforms to trade on, and their own techniques.
And that got me thinking: I have a technique of my own. It helps me limit my selection, identify prime trade opportunities, and make sure that I get high-quality, growth-oriented stocks if I get assigned - all of it, right from the get-go.
So I figured, why not share it?
That’s exactly what I’ll be doing today. I’ll show you my ultimate cash-secured put screener, which filters I use and why, and how Barchart’s extensive options and stock screening tools can help you find winning trades for consistent, reliable income.
What Are Cash-Secured Puts?
But first, let’s cover the definitions. If you’re new to options trading, or you’re booking for a refresher on cash-secured puts, you’re in the right place.
A put option is a contract that gives the buyer the right but not the obligation to sell an underlying commodity or asset at a specified price, known as the strike price, on or before a specified date, known as the expiration date.
A cash-secured put is an options strategy from the seller’s side of the trade that involves selling a put option on an underlying asset to earn a premium while setting aside enough capital to buy the shares should you get assigned. And since you’re setting aside capital to potentially buy the stock, you’d of course want high-quality stocks that have excellent growth potential.
Cash-secured puts are different from naked puts because your downside risk is fully funded. With a naked put, you’re relying on margin to cover you in the event of assignment. With a cash-secured put, the capital is already set aside, so there are no surprises if assignment happens.
Because of that, cash-secured puts are generally considered a more conservative income strategy. You’re not using leverage, you’re defining your risk upfront, and you’re combining income generation with a potential stock entry at a lower price. That makes them especially attractive for long-term investors who want to build positions gradually while getting paid to wait.
Now, that you know what a cash-secured put is, you’ll want to narrow your choices down to the best opportunities, like stocks with strong fundamentals, healthy liquidity, and options premiums that actually make the risk worthwhile.
And that’s exactly where Barchart’s Naked Puts Options Screener comes in.
Cash-Secured Put Screener
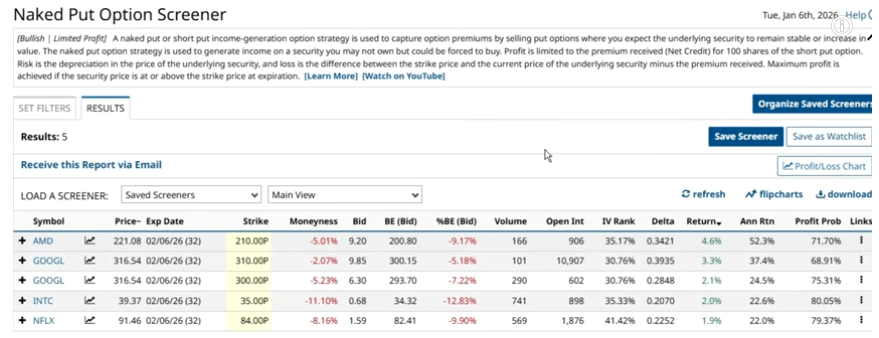
Barchart’s default cash-secured put screener can be found in the Options tab under Naked Put.
The default screener includes important details for your trade - all the necessary information to help you decide.
Later, I’ll show you how to customize the screen. But for now, let’s stick with the default filters and I’ll quickly cover what everything means in the results.
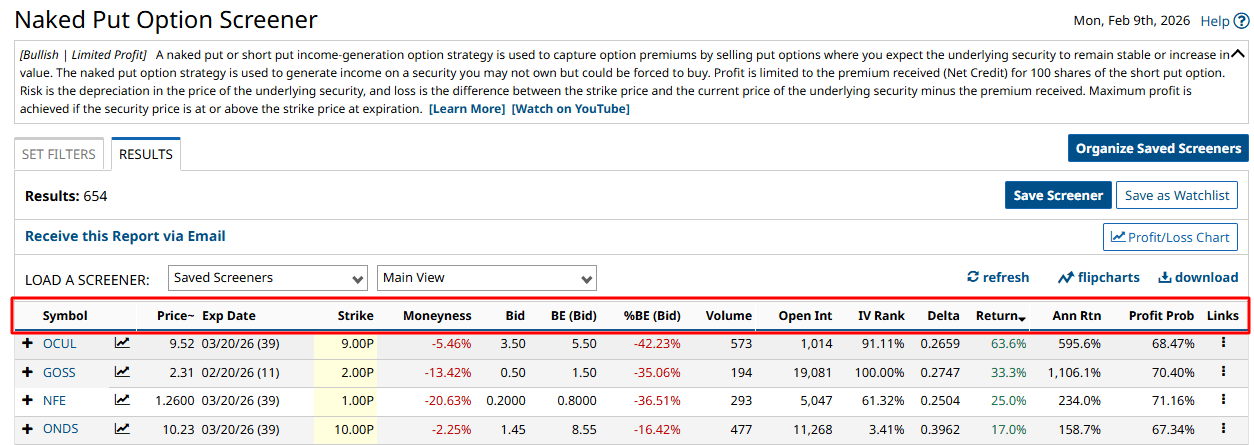
First is the asset’s current trading price and expiration date, which is important context when trading options. The parentheses here indicate the days to expiration, or DTE.
Next is the actual strike price. Now, with a cash-secured put, you’ll usually sell one with a strike price below the current trading price. If you want to generate income with a lesser chance of being assigned, you sell an even lower strike price. I’ll talk more about how to choose your strike price in a bit.
The next column is moneyness - specifically, how far away the strike price is from the current price. Negative moneyness means the trade is out of the money, which in this case means the strike price is lower than the trading price. Positive moneyness means it’s in the money and is at risk of assignment.
Next is the bid column. This shows how much people are willing to pay for the specific put option.
Next up is the breakeven column and breakeven percentage, which shows you the exact stock price at expiration where your short put neither makes nor loses money. For short puts, it’s simply the strike price less the bid or the credit you receive.
Next, option volume is just like stock volume - the amount of contracts that were traded in the last session.
Then we have open interest, which is the total number of outstanding, active contracts that have not been settled or closed within the specified expiration period.
You need to know these details in order to see if the option you’re interested in selling is liquid. Liquidity here can potentially mean the difference between entering or exiting a trade with a tight spread… or getting stuck with terrible pricing.
You see this every time in online marketplaces. People sell items that nobody else wants, and so most of them are forced to lower the prices again and again until a buyer becomes interested.
That’s exactly how illiquid options trading works. If there’s no demand to buy your put option, you’ll have to lower your price to meet the bidders’ preferred prices. But remember, options come with a limited timespan, and with it comes a bit of extra value, which I’ll cover in a bit.
Regardless, running up against the clock can become a problem when you need to adjust or exit the position quickly, and you may end up selling for less or paying a higher premium than you expected.
High volume means your order will get filled quickly without having to chase the price. And strong open interest tells you there are plenty of other contract owners in play that might be willing to buy.
The next column here shows delta, the options Greek that measures how much option premiums change based on every $1 change in the underlying’s price. Delta is shown as positive for short puts because the net to the seller increases as the underlying increases.
By the way, I made an entire video covering Greeks, feel free to check it out if you want the full deep-dive.
Now, aside from that, delta can also be used as a shorthand indicator of the chances that an option will expire in the money.
For example, a 24-delta short put means the trade has a 24% chance of expiring in the money. Of course, it also means the option has a 76% chance of expiring out of the money - which is usually the goal in selling cash-secured puts. I usually limit this to between 20 and 30 for a good balance between a higher success of it expiring unassigned, and getting reasonable premiums.
Next, we have return and annualized return.
Return shows how much you earn relative to the capital you set aside to cover the short put. Annualized return just extends the actual return to show what it would look like over 12 months.
Next, and this is likely where most new traders look into the most, is the profit probability column. This metric displays the likelihood of the underlying stock trading above the breakeven price at expiration. The higher the probability, the lower the chances of assignment.
Profit/Loss Chart
Now, if you want to dive further into your trade details, you can click the P/L chart button right here or the chart icon beside the expiration date.
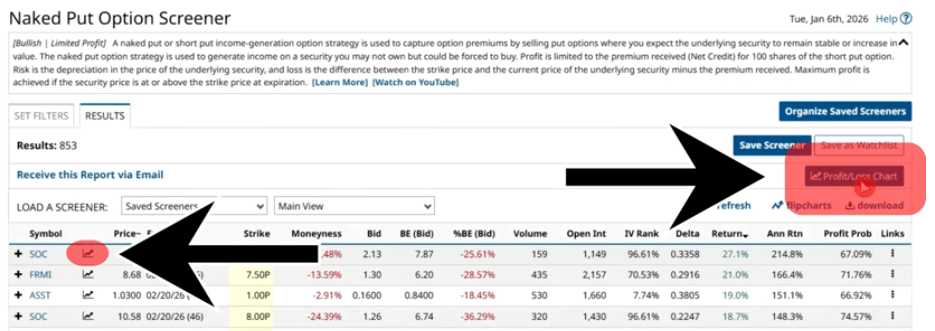
Here, you’ll get everything that matters: breakevens, Greeks, volatility, trend strength, even the discount that you’ll get if you get assigned, all of it.
By the way, I covered how to use the P&L chart when selling cash-secured puts in this video.
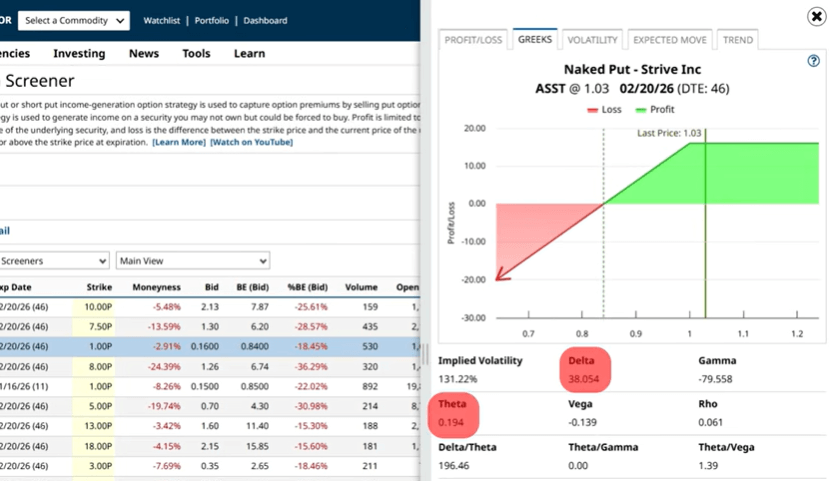
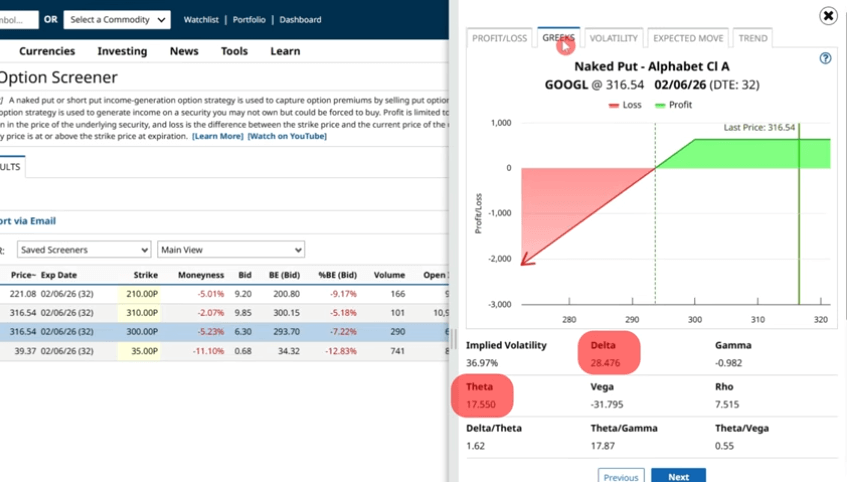
For now, let’s cover a few key tabs - Greeks and Expected Move. In the Greeks tab, you usually want to keep an eye on delta and theta.
Now, I already covered delta. But - theta is equally important as it indicates how much the option will lose in value each day, assuming everything else stays the same - including the underlying security’s price. This is also known as time decay.
For long options, theta appears as a negative number because the option loses value daily. For example, a theta of -0.10 means the option drops about 10 cents per day if the underlying doesn’t move.
For short options, theta is positive because the effect benefits the seller.
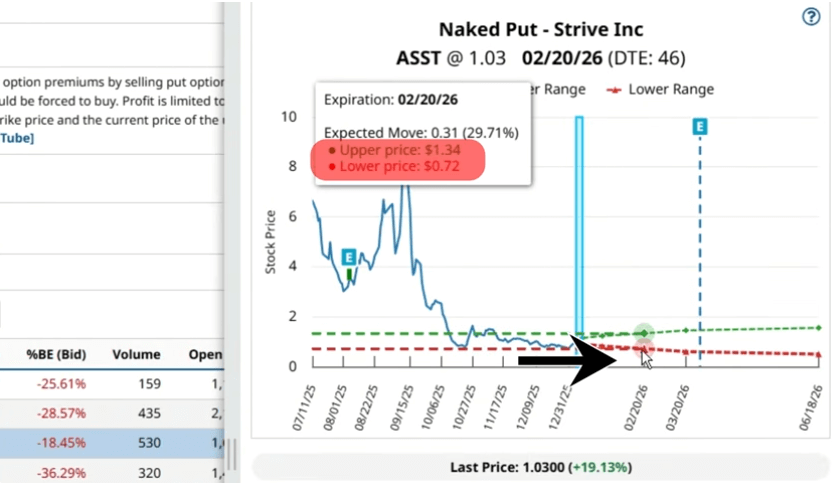
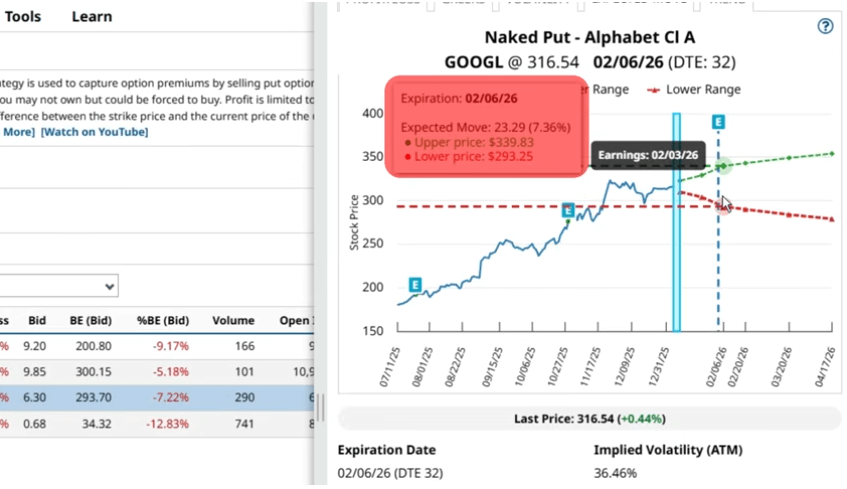
The expected move tab shows the anticipated upper and lower price ranges for the stock’s trading price based on 85% of at-the-money straddle premiums.
When you’re selling a short put, you’d usually want to set your strike price a bit below the lower range. That way, you decrease your chances of getting assigned.
Setting Filters on the Naked Put Screener
So, now that we have the default screener ready, and its results, what do we need to do to bring it to the next level?
You’ll start by clicking "Set Filters." Here you’ll get all the default filters, and their values. Then, you can do your own customization.
When selecting stocks to sell cash-secured puts on, I prefer to limit my selection by adding the Market Cap filter and setting the values to $3 billion and above. That way, I avoid small and micro-cap companies and the volatility that comes with them.
Then, I add the Implied Volatility filter, or IV. IV tells me how much an asset’s price is expected to move. IV is critical because it directly impacts option prices. The more the market expects a stock to move, in either direction, the higher the options premiums become, regardless of direction.
I’ll set the filter to search for 30 to 60% for implied volatility. That’s enough volatility to make it worthwhile to trade, but not so much as to put you at risk of massive price movements.
Then, I add IV Rank. This measures the current IV's position compared to the past year, or more specifically, where it sits in the range. For example, if IV is high now compared to the past, IV Rank will also be high, meaning premiums or options prices will be higher than usual. I’ll set IV rank to 30% and above.
Then, I’ll scroll down to the Security Type filter and add in ETFs, then in the Days to Expiration or DTE filter, I’ll change it to 30 to 45 days and add in weekly options to expand my search.
And there we have it. We’ve got five results. Much better than the 800 we had before. But are we sure all these are ideal? I think I’ll want to double-check using another indicator, because that’s not all you can add to your ultimate screener.
My Ultimate Screener
Barchart’s Option Screener also integrates with the stock screener, which means you can access all these stock filters for your screen.
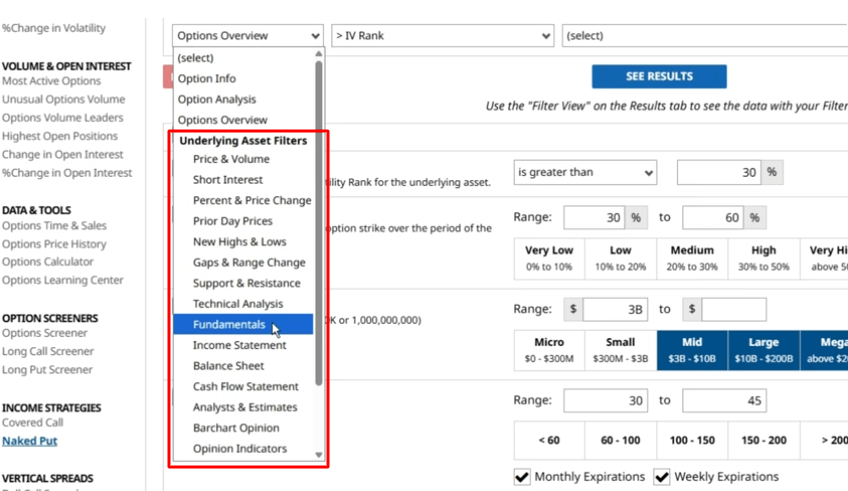
The screener has a bunch of filters for technical analysis. There’s RSI, Bollinger Bands, which I covered in my Ultimate Covered Call Screener video, and others like Moving Average Convergence-Divergence or MACD, Average True Range, and more.
But when it comes to selling cash-secured puts that are about a month out, why not use the short- and medium-term buy, sell, or hold signal filter from Barchart’s Technical Opinion feature? The results will fit in perfectly with the signal.
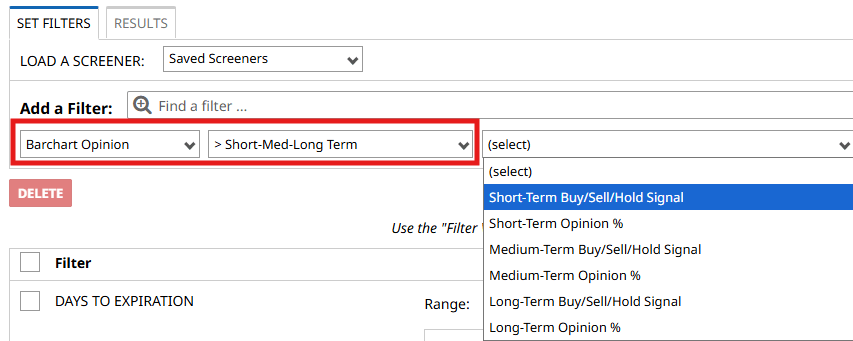
Barchart Technical Opinion is our own proprietary tool that looks at an underlying’s price history using 13 of the most popular indicators across short, medium, and long-term timeframes to generate buy, sell, or hold signals. For each indicator, the system assigns a numeric value based on where the underlying's current price sits - relative to the indicator’s opinion.
We then consider all the values to get an overall percentage, giving traders a good idea whether the balance of indicators points toward buying, selling, or holding.
We also show signal strength and signal direction. Strength tells us how powerful the signal is compared with its historical behavior, and direction tells us whether a buy or sell signal is strengthening, weakening, or steady. For hold signals, direction indicates whether they are trending toward a buy or a sell - all of which makes it highly useful when selling cash-secured puts.
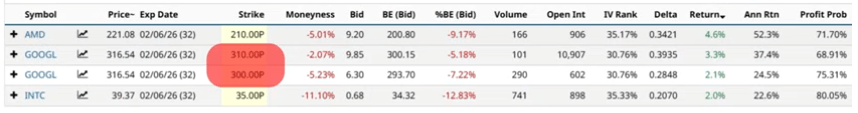
And so, I’ll add the Opinions here, and select “Buy” ratings for both the short and medium terms. And if I run the screen now, I now get a shorter list of high-quality companies with relatively high volatility, favorable technical indicators, and a high chance of expiring worthless.
Now, any of these would probably make good trades, but, since I follow Alphabet a lot - I’m more partial to it, perhaps the $310 or $300 put strike on Alphabet, which is currently trading at around $316. So let’s break down the $300 strike.
Trade Breakdown
According to the screener, you can sell a 300-strike cash-secured put on Alphabet and receive $6.30 per share or $630 per contract. The option expires on February 6 - which is in 32 days - at least from the time of recording.
The strike price is 5% out of the money, and you’ll get around a 7% discount based on Google’s current trading price - if you get assigned.
If the stock trades above $300 by February 6, you keep the premium as profit, the option disappears from your account, and you’re free of any other obligations. If it trades below $300 by February 6, you will get assigned. That means you’ll buy 100 shares of Alphabet stock at $300, regardless of its current trading price.
If we check the Greeks tab, this trade has a delta of 28, which is within my standard range of 20 to 30, and has a theta of 17.55, meaning the option will lose roughly 18 cents every day, though this value will increase as expiration draws near.
Now, if we jump over the expected move tab, we can see that Alphabet is expected to trade between $293 and $340 by February 6, at least, based on at-the-money straddle prices.
Ideally, you’d set a cash-secured put’s strike price below that $293 lower range. But in this case, I’ll still take the trade, because right now, Alphabet stock is quite popular, it’s up more than 70% over the last year, and investors are very bullish on it. And not only that, its short- and medium-term technical ratings are bullish. Of course, if you wanted to lean on the more conservative side, you could absolutely pick a strike around $293 - you’ll just earn a little less.
Then, there’s also the fact that you only want to sell cash-secured puts on stocks that you’d like to own. If you get assigned, you get Alphabet at a 7% discount relative to what it’s trading for today.
And lastly, we can see here on the expected move graph that Alphabet is releasing its earnings on February 3, 3 days before the option expires. In a perfect world, you want to sell options that expire before earnings are released. That way, you can benefit from higher implied volatility, which directly translates to higher option premiums. Three days is a bit of a sweet spot.
Risk Management
Now, even though cash-secured puts are considered a more conservative options strategy, they are not risk-free. The biggest risk is straightforward: if the stock drops sharply below your strike price, you’re still obligated to buy the shares at that higher strike, regardless of how far the price falls. That’s why stock selection matters more than anything else.
This is also why I always stress selling puts only on companies you’re genuinely comfortable owning for the long term. If the trade goes against you, you get something out of it, which is the stock. You’re simply transitioning from an income trade into a stock position with a price that you chose.
And lastly, choosing the “correct” days to expiration also matters. Shorter-dated options decay faster, which benefits the seller, but they also leave less time for the stock to recover if it makes a sudden move. Longer expirations offer more breathing room, but they tie up capital for longer. This is why the 30–45 DTE range often strikes a good balance between premium, flexibility, and risk.
Final Thoughts
Selling cash-secured puts can be a good way to earn income while waiting to buy high-quality stocks at a discount. When done correctly, you’re getting paid upfront, defining your risk, and putting yourself in a position to own companies you already believe in.
That said, this isn’t a set-it-and-forget-it strategy. Stock selection, strike choice, expiration timing, and risk management all matter. If you rush the process or chase premiums on low-quality names, things can go south very quickly.
But if you stay disciplined, focus on liquid stocks, and use tools like Barchart’s options screener to increase your chances of success, cash-secured puts can be a powerful tool to add consistent income to your portfolio.