The information and opinions expressed below are based on my analysis of price behavior and chart activity
Sign Up to receive Walsh Trading’s 1st Half of 2026 Market Outlook First Half of 2026 Outlook for the Livestock and Grain markets.
Wednesday, March 18, 2026
May Soybean Oil (Daily)
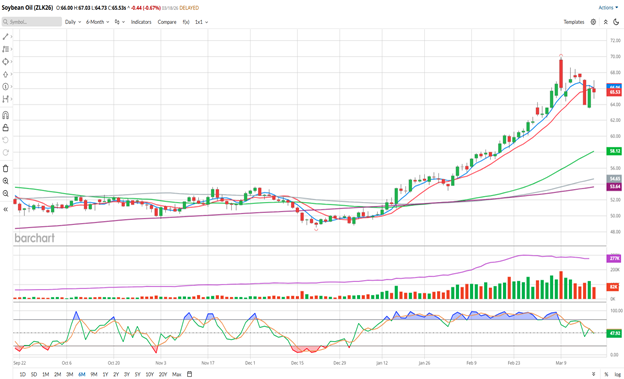
Today, May Bean Oil settled at 65.53, down 0.44 from Tuesday’s close. Since the contract high on March 9th, Bean Oil prices have been working their way lower. Today’s activity did see a higher high and higher low, relative to yesterday. Even though that’s typically bullish behavior, it does appear to me that this market is due for a retracement. Bullish momentum has eroded and yesterday’s gain of 2.03 may have just been “Turnaround Tuesday” type of trade.
Overall, I think this market has been in an uptrend since the middle of January, when we saw the most recent closes back above the 50- and 100-day moving averages. Before that, you may notice, the trend appeared to be flat, with prices bouncing between the 100- (grey) and 200-day (purple) moving averages. The 5- and 10-day moving averages (blue/red) have made a bearish crossover today and are both above the market close at 66.06 and 66.15, respectively. Those averages have been in a bullish configuration since February 4th. This trend has been strong, as that bullish cross negated the bearish cross that occurred the day before, on February 3rd. The 50-day average (green, 58.12), the 100-day (grey, 54.65) and the 200-day (purple, 53.64) are all well below the market and still pointing higher. Those averages may offer good support targets, should the market turn aggressively lower. Stochastics (bottom sub-graph) are mid-range and trending lower, since dropping out of an overbought condition on March 9-10. I’m not turning into a long-term bear, but the technicals seem to be weakening and pointing toward lower prices. Given how far the market has rallied, I think there’s a potential opportunity to the short side.
The recent trend higher has been spurred (recently) by the war with Iran. Before that happened, the market was already trending higher as traders are anticipating a new biofuel mandate from the US Gov’t. That mandate has been delayed several times and I believe that it was leaked last week by a major newswire. That might explain the limit down move on Monday in Bean Oil and nearby (old crop) Soybeans. Allegedly. The “official” announcement may come at the end of next week on the 27th, at a White House event. I think this may be a “buy the rumor, sell the fact” type of setup. Price volatility has certainly jumped higher over the past few weeks, as evidenced by the larger price swings happening with greater frequency than previously.
Aggressive and well-margined traders may do well to consider establishing short futures positions. Perhaps a short entry at 66.00 would work well. I would suggest a GTC Buy stop just above Monday’s high of 67.15, perhaps at 67.25. If that Stop were hit, that would result in a loss of $750 per contract before your commissions/fees. You may want to make that stop a reversal, as well, and flip that position back to the long side. I don’t expect the signal to reverse, like it did in February, but it’s certainly possible. Look to exit the short position at 58.00. Should that exit be triggered, that would result in a gain of $4,800 per contract, before your commissions/fees.
Traders that prefer options may do well to consider buying Puts. May Bean Oil options expire in 37 days. The 61.00 May Puts settled at 1.030 today, or $618 out-of-pocket. I would suggest trying to buy those Puts for 1.000 or $600 per option, before your commissions/fees. Place a GTC order to sell those Puts at 4.000. If that order is triggered, that would result in a gain of $1,800 per option, before your commissions and fees.
May Soybean Oil (Weekly)
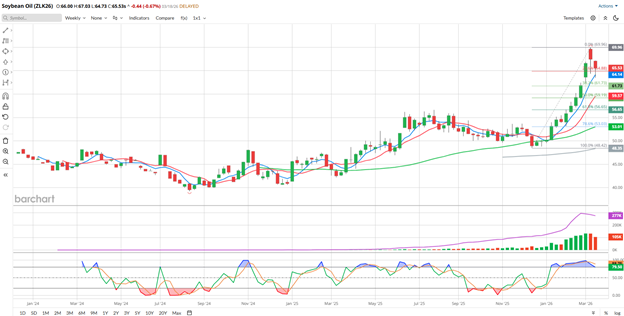
For the week, May Soybean Oil is down 1.91 from last Friday’s close. The last two bars on the weekly chart, this week and last, both seem to show good buying interest. I think you might see the long wicks at the bottom of those bars/candles. The 5-week moving average (blue, 64.14) has acted as support this week. That is the first time it’s been tested since the first week in February. The 10-week (red, 59.57) has not been tested, since those weekly averages made a bullish crossover in mid-late January. Both of those are still pointing higher and offering support. As are the 50-week (green, 53.01) and the 100-week (grey, 48.35) and I don’t think those long-term trend averages are in play, just yet. Stochastics (bottom sub-graph) are starting to tick out of overbought status, but are still at elevated levels. I’ve added a Fibonacci retracement to the weekly chart. I think that if this bearish retracement develops, the 50% (59.19) or 62% (56.65) should offer strong potential support.
Sign Up to receive Walsh Trading’s 1st Half of 2026 Market Outlook First Half of 2026 Outlook for the Livestock and Grain markets.
If you like what you’ve read here and would like to see more like this from Walsh Trading, please Click here and sign up for our daily futures market email.
Jefferson Fosse Walsh Trading
Direct 312 957 8248 Toll Free 800 556 9411
jfosse@walshtrading.com www.walshtrading.com
Walsh Trading, Inc. is registered as a Guaranteed Introducing Broker with the Commodity Futures Trading Commission and an NFA Member.
Futures and options trading involves substantial risk and is not suitable for all investors. Therefore, individuals should carefully consider their financial condition in deciding whether to trade. Option traders should be aware that the exercise of a long option will result in a futures position. The valuation of futures and options may fluctuate, and as a result, clients may lose more than their original investment. The information contained on this site is the opinion of the writer or was obtained from sources cited within the commentary. The impact on market prices due to seasonal or market cycles and current news events may already be reflected in market prices. PAST PERFORMANCE IS NOT NECESSARILY INDICATIVE OF FUTURE RESULTS. All information, communications, publications, and reports, including this specific material, used and distributed by Walsh Trading, Inc. (“WTI”) shall be construed as a solicitation for entering into a derivatives transaction. WTI does not distribute research reports, employ research analysts, or maintain a research department as defined in CFTC Regulation 1.71.

/A%20close-up%20of%20a%20SpaceX%20sign%20by%20Sundry%20Photography%20via%20Adobe%20Stock.jpeg)

/AI%20(artificial%20intelligence)/AI%20chip%20by%203Dsss%20via%20Shutterstock.jpg)
