Geopolitical Fire and a Fed on Hold: What Is Driving the ES Right Now?
The dominant force on the tape right now is the U.S. and Israeli military campaign against Iran, which launched on February 28, 2026 under Operation Epic Fury. On March 2, a senior IRGC official confirmed the Strait of Hormuz was formally closed, threatening roughly 20% of the world's daily oil supply. Brent crude surpassed $100 per barrel on March 8 for the first time in four years, reaching as high as $126 per barrel at its peak. Each successive headline out of the region has translated directly into gap opens and elevated intraday volatility on the ES, with the futures market increasingly trading as a real-time proxy for geopolitical risk sentiment. Iran retaliated against regional energy infrastructure, with Saudi Aramco's Ras Tanura refinery forced to halt operations and QatarEnergy's Ras Laffan LNG facilities targeted, briefly pushing global gas prices to a three-year high. These developments contributed directly to the ES losing its grip on the 6800 area as risk-off flows accelerated.
On March 14, President Trump announced that U.S. forces struck Iran's Kharg Island, home to the country's main crude export terminal. For the ES, this represents the single most important tail risk on the board: a further escalation targeting Gulf energy infrastructure broadly would likely trigger a disorderly move lower, overwhelming near-term technical support levels.
The February CPI report released on March 11 showed headline inflation at 2.4% year over year, but analysts widely noted this data predates the energy shock entirely and is largely backward-looking. The Fed is overwhelmingly expected to hold rates unchanged at its March 18 meeting at 3.50% to 3.75%, reinforcing a higher-for-longer stance that limits the policy cushion available to support the ES in a deeper drawdown. CFTC data updated March 13 showed net speculative positions in S&P 500 futures improving to minus 134,500 contracts from minus 168,200 contracts the prior week, suggesting some bearish bets are being trimmed. However, with positioning still net short, meaningful fuel for further liquidation remains if the 6600 area fails to hold.
What the Market Has Done
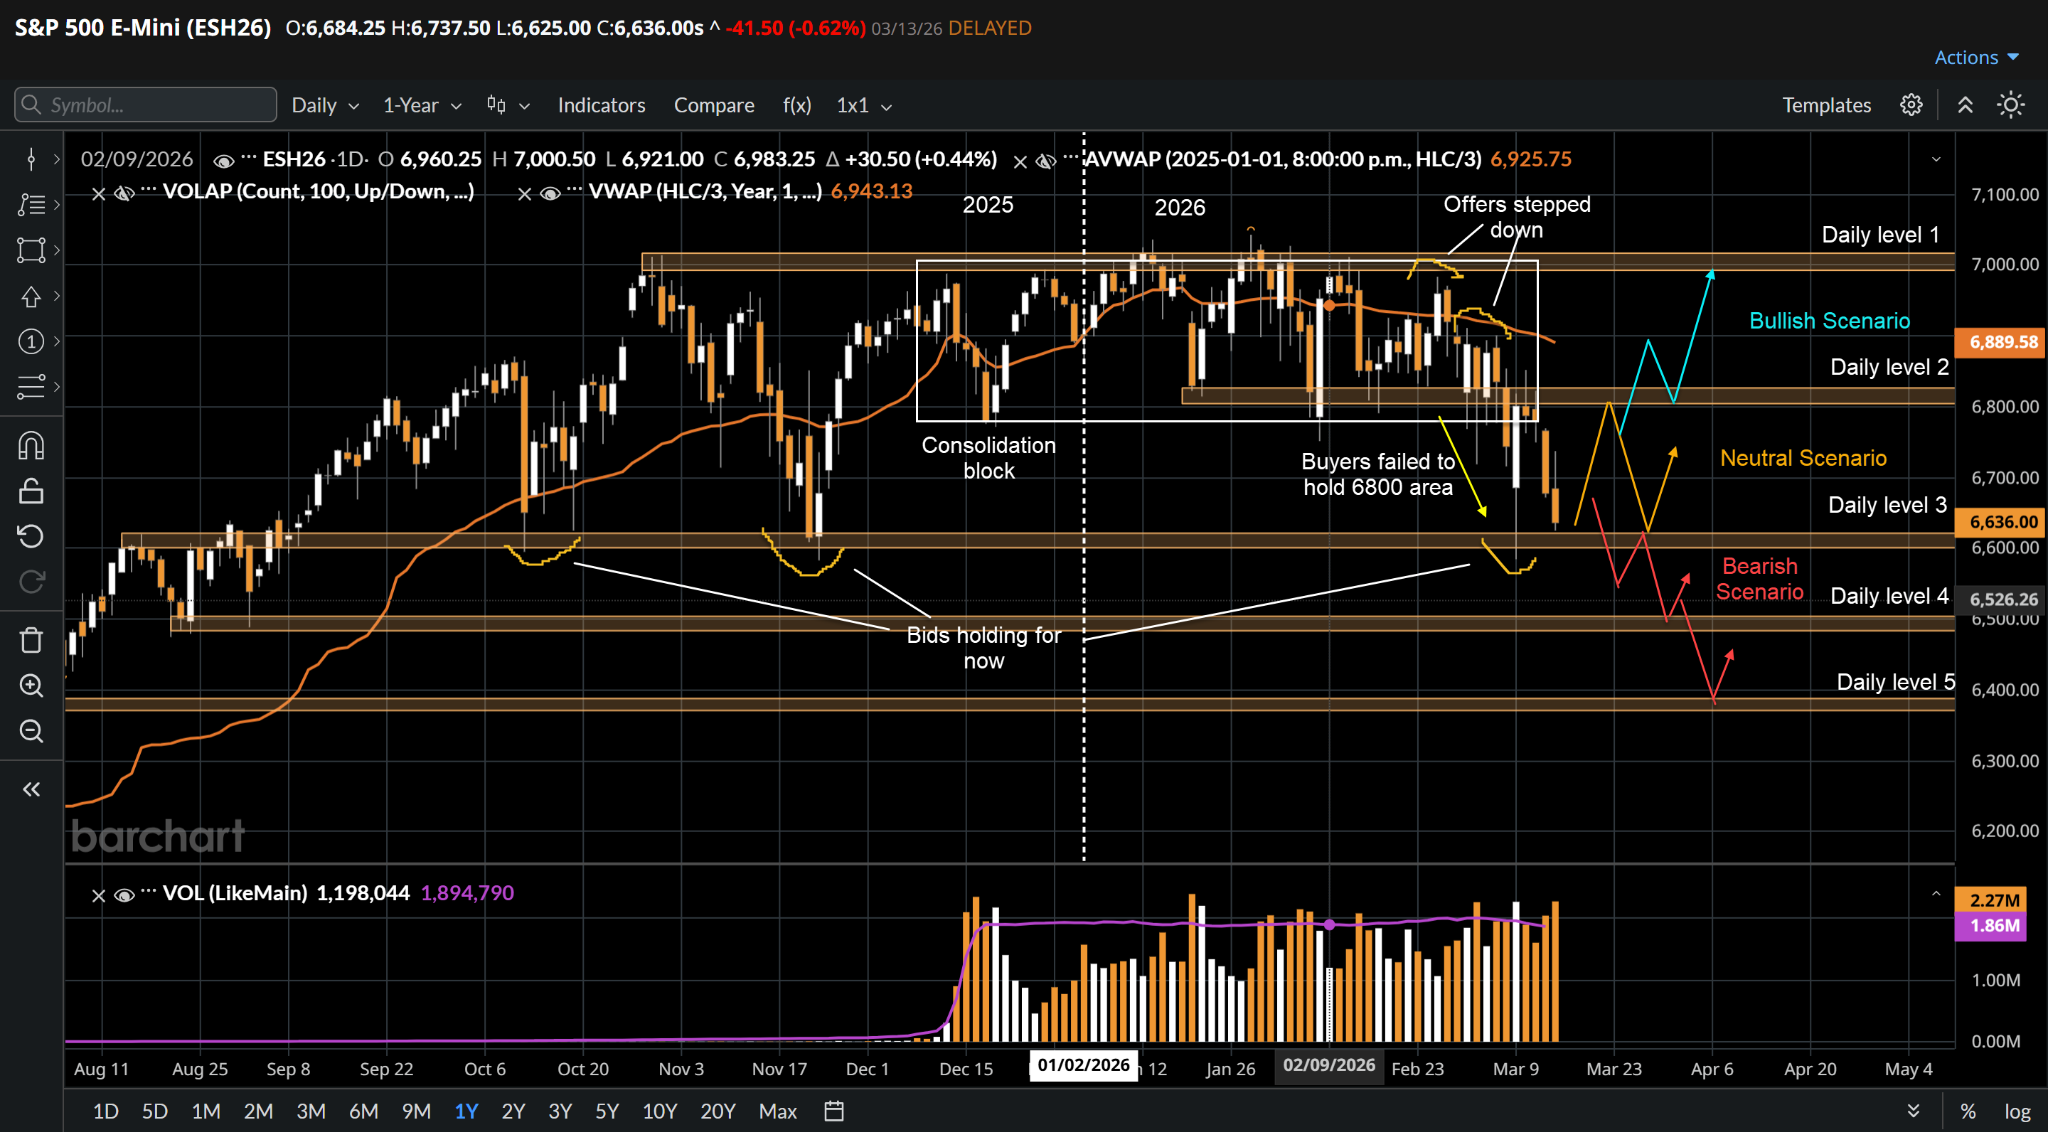
- The ES has been in a sideways consolidation since October 2025, grinding between key structural levels with no clear directional resolution. The market has repeatedly been rejected in the 6,950 to 7,000 area, which lines up with a clear supply zone on the daily chart.
- Since the start of 2026, buyers successfully defended the 6800 area (daily level 2) on multiple tests but were unable to sustain any meaningful extension beyond the 7000 area (daily level 1), which serves as both a psychological and structural resistance level.
- In February, as the Iran conflict escalated and macro uncertainty increased, sellers stepped down their offers and buyers eventually lost control of the 6800 area. Prices rotated down toward the key 6600 area (daily level 3). The ES found a technically significant floor at the 6600 area (daily level 3), drawing a sharp response from buyers and producing a meaningful swing from the lows back toward the 6800 area within the same session.
- Buyers responded strongly from the 6600 area last week, but they failed to reclaim above 6800 as sellers stepped down offers again to defend that area, causing price to rotate back down toward 6600. The S&P 500 fell 1.5% to its lowest close since mid-November on Thursday March 12, with oil volatility and Middle East tensions continuing to drive sentiment.
What to Expect in the Coming Weeks
The key level to watch is the 6600 area (daily level 3).
Neutral Scenario
- If buyers are able to defend 6600 and bid prices back up toward the 6800 area, expect a two-way auction to re-establish value before any further directional resolution.
- With geopolitical headline risk remaining elevated on a day-to-day basis, choppy range-bound price action between 6600 and 6800 is a realistic base case.
- This scenario reflects a market attempting to digest both the technical damage and the macro uncertainty before committing to a directional move.
Bearish Scenario
- If buyers fail to defend the 6600 area, expect further long liquidation down toward 6500 (daily level 4), and potentially an extension toward the 6400 area (daily level 5).
- A meaningful escalation of the Iran conflict, particularly any sustained disruption to Gulf energy infrastructure beyond current levels, would be a primary catalyst to watch.
- A materially hotter-than-expected March CPI reading that forces the market to price out any remaining 2026 rate cut expectations could be an additional catalyst that overwhelms buyers at this level.
Bullish Scenario
- If buyers are able to accept above the 6800 area with conviction, expect a move up through the consolidation block toward the 7000 level (daily level 1).
- A credible de-escalation in the Iran conflict, whether through diplomatic progress or a meaningful reduction in Strait of Hormuz disruption risk, would be the most significant potential upside catalyst.
- A stable and non-committal March 18 Federal Reserve statement that avoids hawkish surprises could provide the additional confidence bulls need to press higher.
Conclusion
Technically, the ES sits at one of the most consequential junctions of this entire consolidation structure. The 6600 area has now been tested twice, and the market's response to this level in the coming days will likely define the character of price action well into Q2. From a macro and fundamental perspective, the equation has become genuinely complex: the February CPI at 2.4% suggests underlying disinflation was tracking reasonably well before the conflict began, but the energy shock from a closed Strait of Hormuz has yet to show up in official data, and the Federal Reserve has almost no room to provide relief without risking a re-inflation event. Stagflation risk is now a live conversation on trading desks in a way it has not been for several years. The coming weeks will be a test of whether this market's long-term structural uptrend can absorb both a geopolitical shock and a monetary policy that remains anchored on hold. Watch the 6600 area closely. How price behaves here will tell you everything you need to know about whether bulls still have genuine conviction or whether this market is setting up for a larger reset.
For traders looking to express views on equity markets, whether bullish or bearish, trading futures offers transparency, centralized pricing, and regulated execution that ETFs and CFDs simply cannot match. EdgeClear provides direct access to global futures markets with reliable execution and trader-focused platforms built for serious market participation, and for traders who want to take their trading to the next level. Check out EdgeClear at edgeclear.com.
Disclaimer:
This article is provided for informational and educational purposes only and does not constitute financial, investment, or trading advice. The analysis presented reflects the author’s market observations and opinions at the time of writing and is not a recommendation to buy or sell any futures contract, security, or financial instrument. Futures trading involves significant risk and is not suitable for all market participants. Losses may exceed initial margin deposits, and market conditions can change rapidly.
Any scenarios, levels, or market expectations discussed are hypothetical in nature and are intended solely to illustrate potential market behavior. They do not represent actual trading results and should not be interpreted as guarantees of future performance. Past performance, market behavior, or historical price action are not indicative of future outcomes.
Readers are solely responsible for their own trading decisions and risk management. Always conduct independent research, consider your financial situation and risk tolerance, and consult with a qualified financial professional, if necessary, before engaging in futures or derivatives trading.
/Advanced%20Micro%20Devices%20Inc_%20office%20sign-by%20Poetra_RH%20via%20Shutterstock.jpg)

/Alphabet%20(Google)%20Image%20by%20Markus%20Mainka%20via%20Shutterstock.jpg)
/Autonomous%20driverless%20aerial%20vehicle%20flying%20by%20Kinwunz%20vis%20Shutterstock.jpg)