Gold has a long history as an inflation barometer. The precious metal is a hybrid, part currency, and part industrial metal. While fabricated demand for jewelry consumes a substantial percentage of annual production, investment demand determines gold’s price path. The world’s central banks and governments validate gold’s role in the worldwide financial system as they hold gold as an integral part of their foreign currency reserves. Meanwhile, governments continue to be net buyers of the precious metal, boosting their holdings.
The $1800 level has become a magnet for the gold price, but the pattern of lower highs and higher lows over the past year suggests that the metal could be on the verge of a substantial move. The fundamental and technical picture favors higher gold prices when the metal decides to move away from the $1800 level.
Lower highs and higher lows
Gold was the first commodity to reach a new all-time high in the months after the outbreak of the worldwide COVID-19 pandemic. The yellow metal rose to $2063 per ounce in August 2020, where it ran out of upside steam.
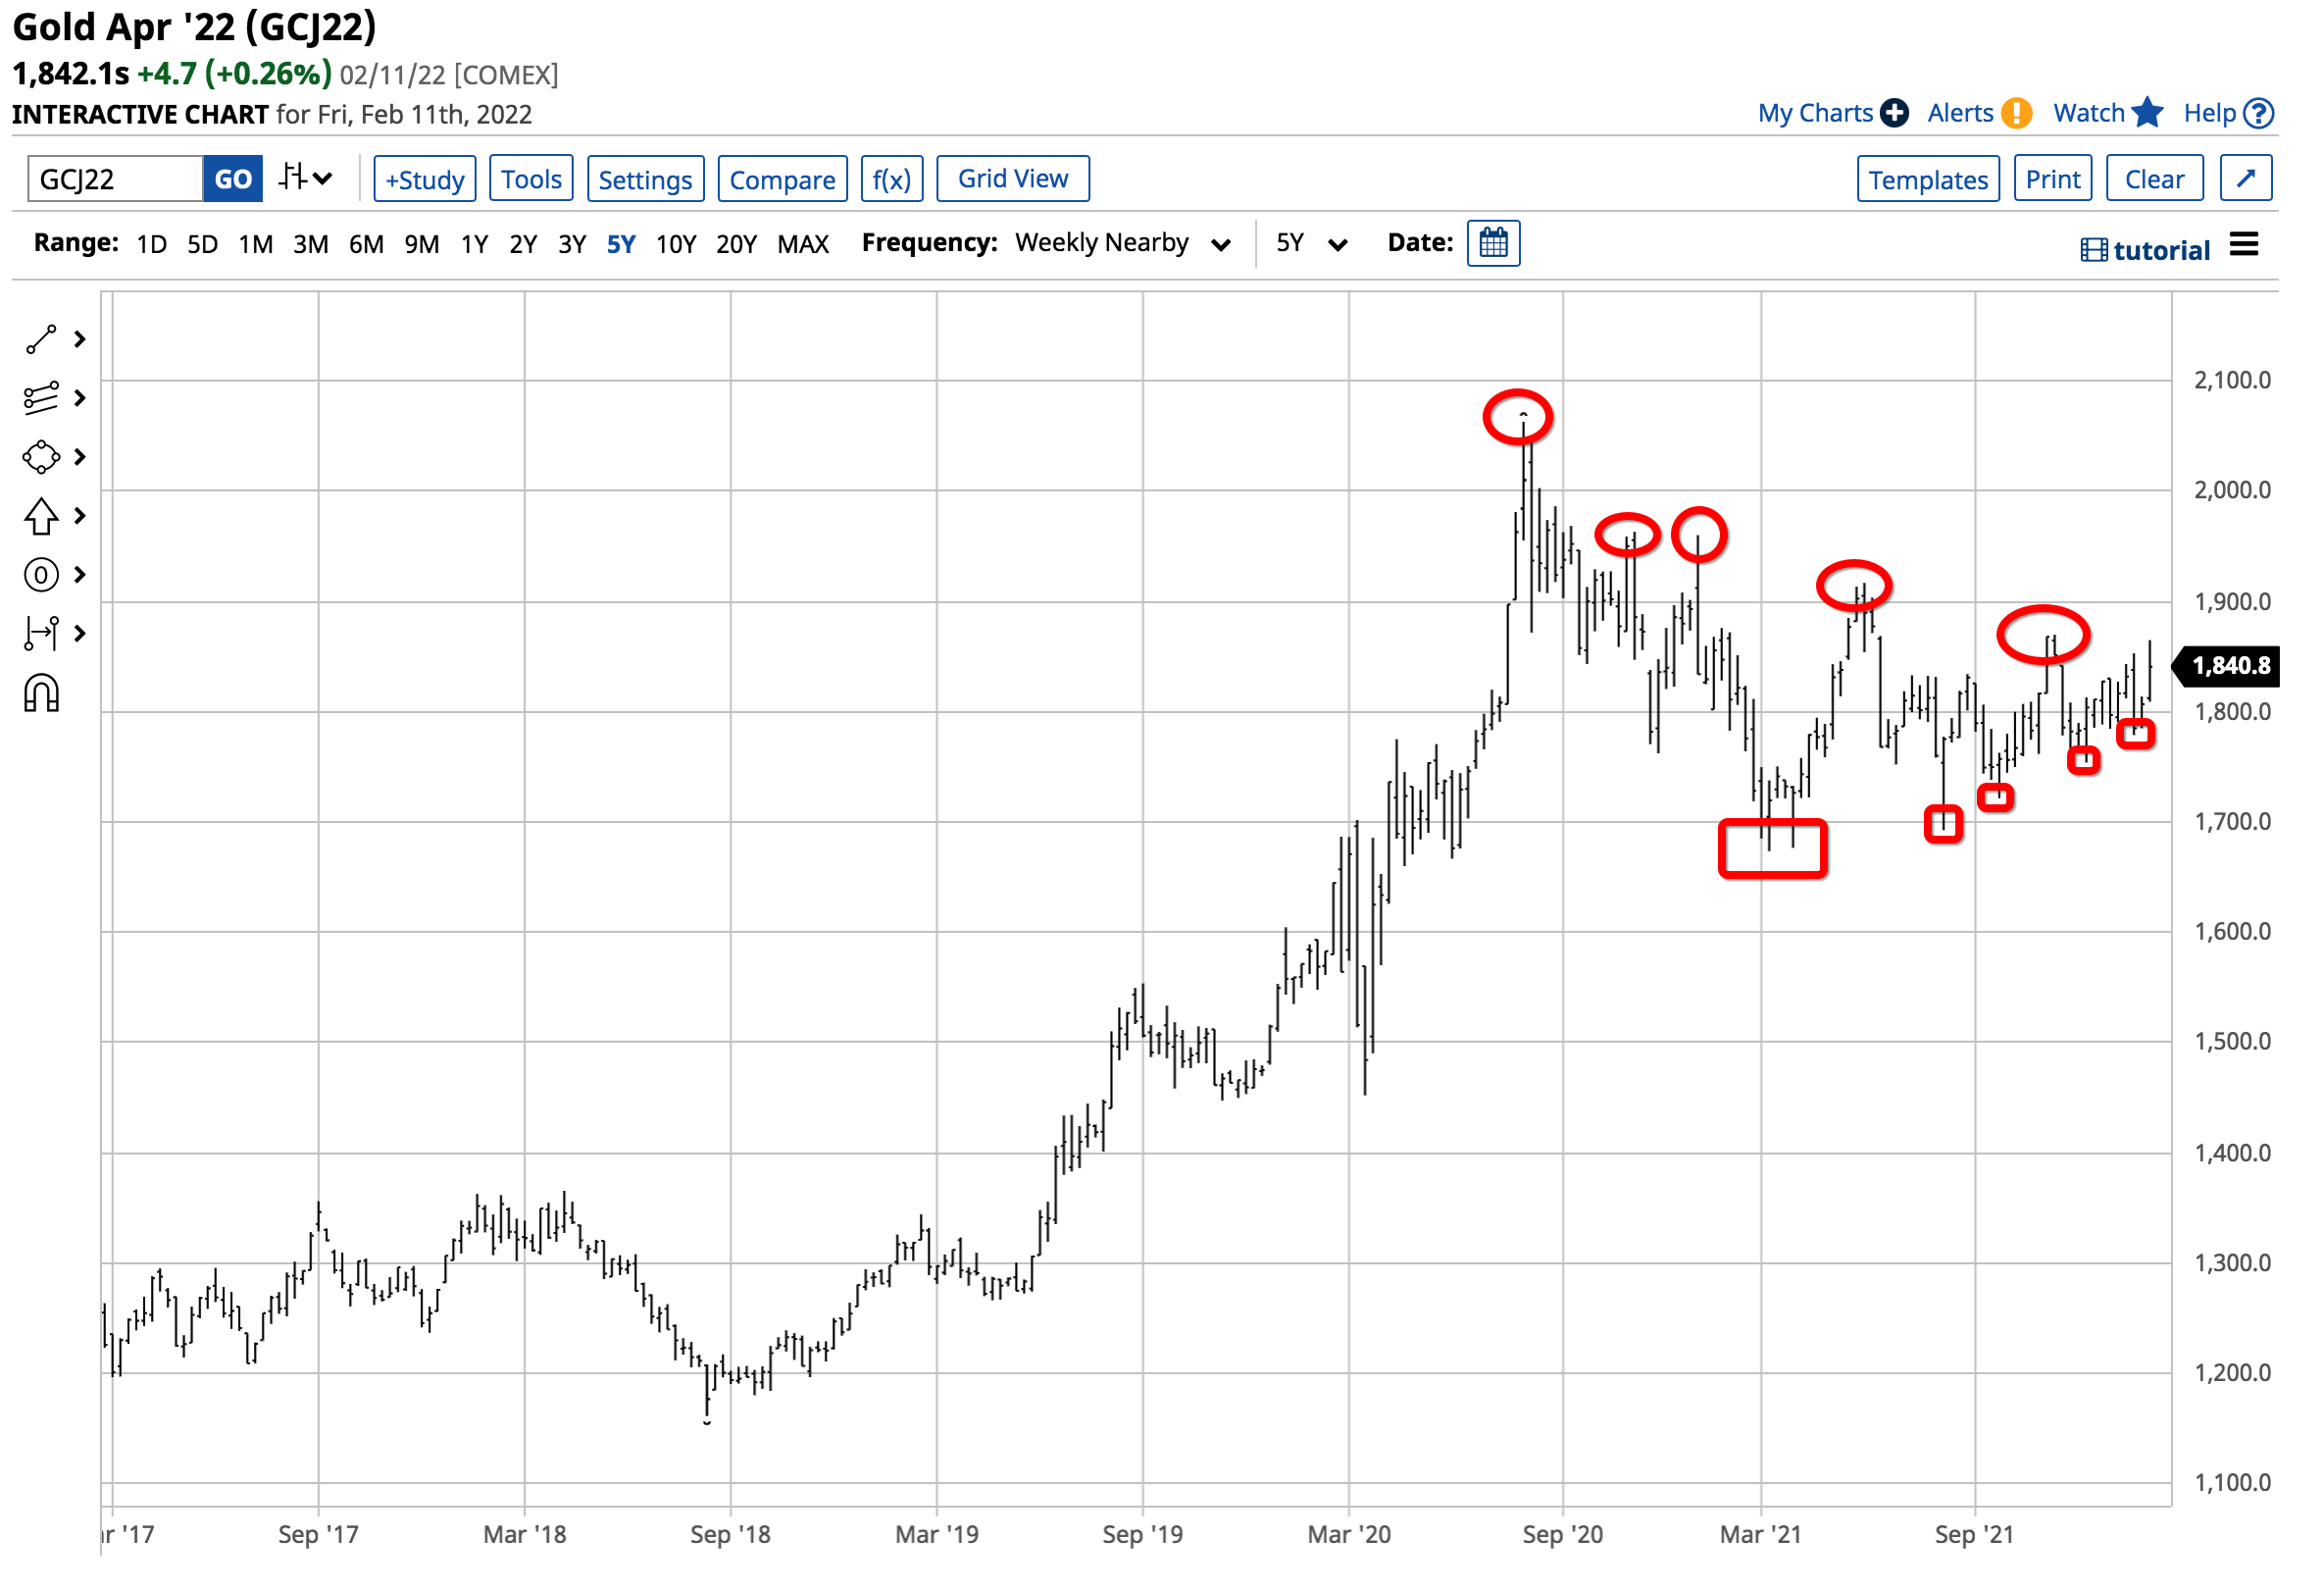
The chart highlights the pattern of lower highs since August 2020, but since March 2021, the precious metals futures have made higher lows. As the wedge pattern narrows, gold becomes a tightly coiled spring that will eventually break out to the up or downside. When it arrives, the move could be substantial. The longer markets consolidate and build cause, the greater the trajectory of the price move. The range in gold has been narrowing for one year.
The latest CPI report says the Fed is way behind inflation
In 2021, the consumer price index rose by 7%, while core CPI, excluding food and energy, moved 5.5% higher. The producer price index gained nearly 10%, and GDP experienced a significant gain. The inflation barometers rose to the highest levels in four decades.
Last week, the report that January CPI rose by 7.5% was another reminder that inflation continues to increase. The US central band is far behind the curve in addressing the economic condition.
As inflation continues to erode money’s purchasing power, the Fed is still purchasing debt securities as it tapers the quantitative easing program. The buying will end in early March, setting the stage for liftoff from a zero percent Fed Funds Rate. At the December FOMC meeting, the central bank told markets to expect the short-term rate to rise to 0.90% in 2022 and 1.60% in 2023. With core inflation sitting around 5.5%, it would take twenty-three hikes of twenty-five basis points for real interest rates to move from negative to positive territory.
Negative interest rates for as far as the eye can see feed inflation and is not bearish for gold, an inflation barometer. In August 2020, gold signaled that central bank liquidity and government stimulus would lead to inflation. In 2022, the yellow metal could move higher, signaling a continuation of the economic condition as central banks have yet to do enough to stem the price pressures.
Central banks continue to add to reserves
Central banks and governments validate gold’s role in the worldwide financial system as they hold the metal as foreign currency reserves. In 2021, governments were net buyers, with the Central Bank of Thailand leading the way, adding 90 metric tons while the Reserve Bank of India bought 77.5 tons. Hungry, Brazil, Uzbekistan, and Kazakhstan also purchased gold in 2021 as the official sector remained net buyers.
Meanwhile, China and Russia are leading gold-producing countries. Chinese and Russian gold reserves are strategic state secrets, so it is impossible to monitor how much they added to their holdings. However, a significant percentage of domestic production has moved into their reserves over the past years .
Central bank buying is ultimately a bullish factor for the gold market and looks likely to continue in 2022.
The breakout level has moved lower
Gold’s wedge pattern means that technical support and resistance levels are moving closer to the current market price, with each lower high and higher low. The longer the pattern continues, and the tighter the breakout or breakdown levels become, the odds of an explosive or implosive move rise.
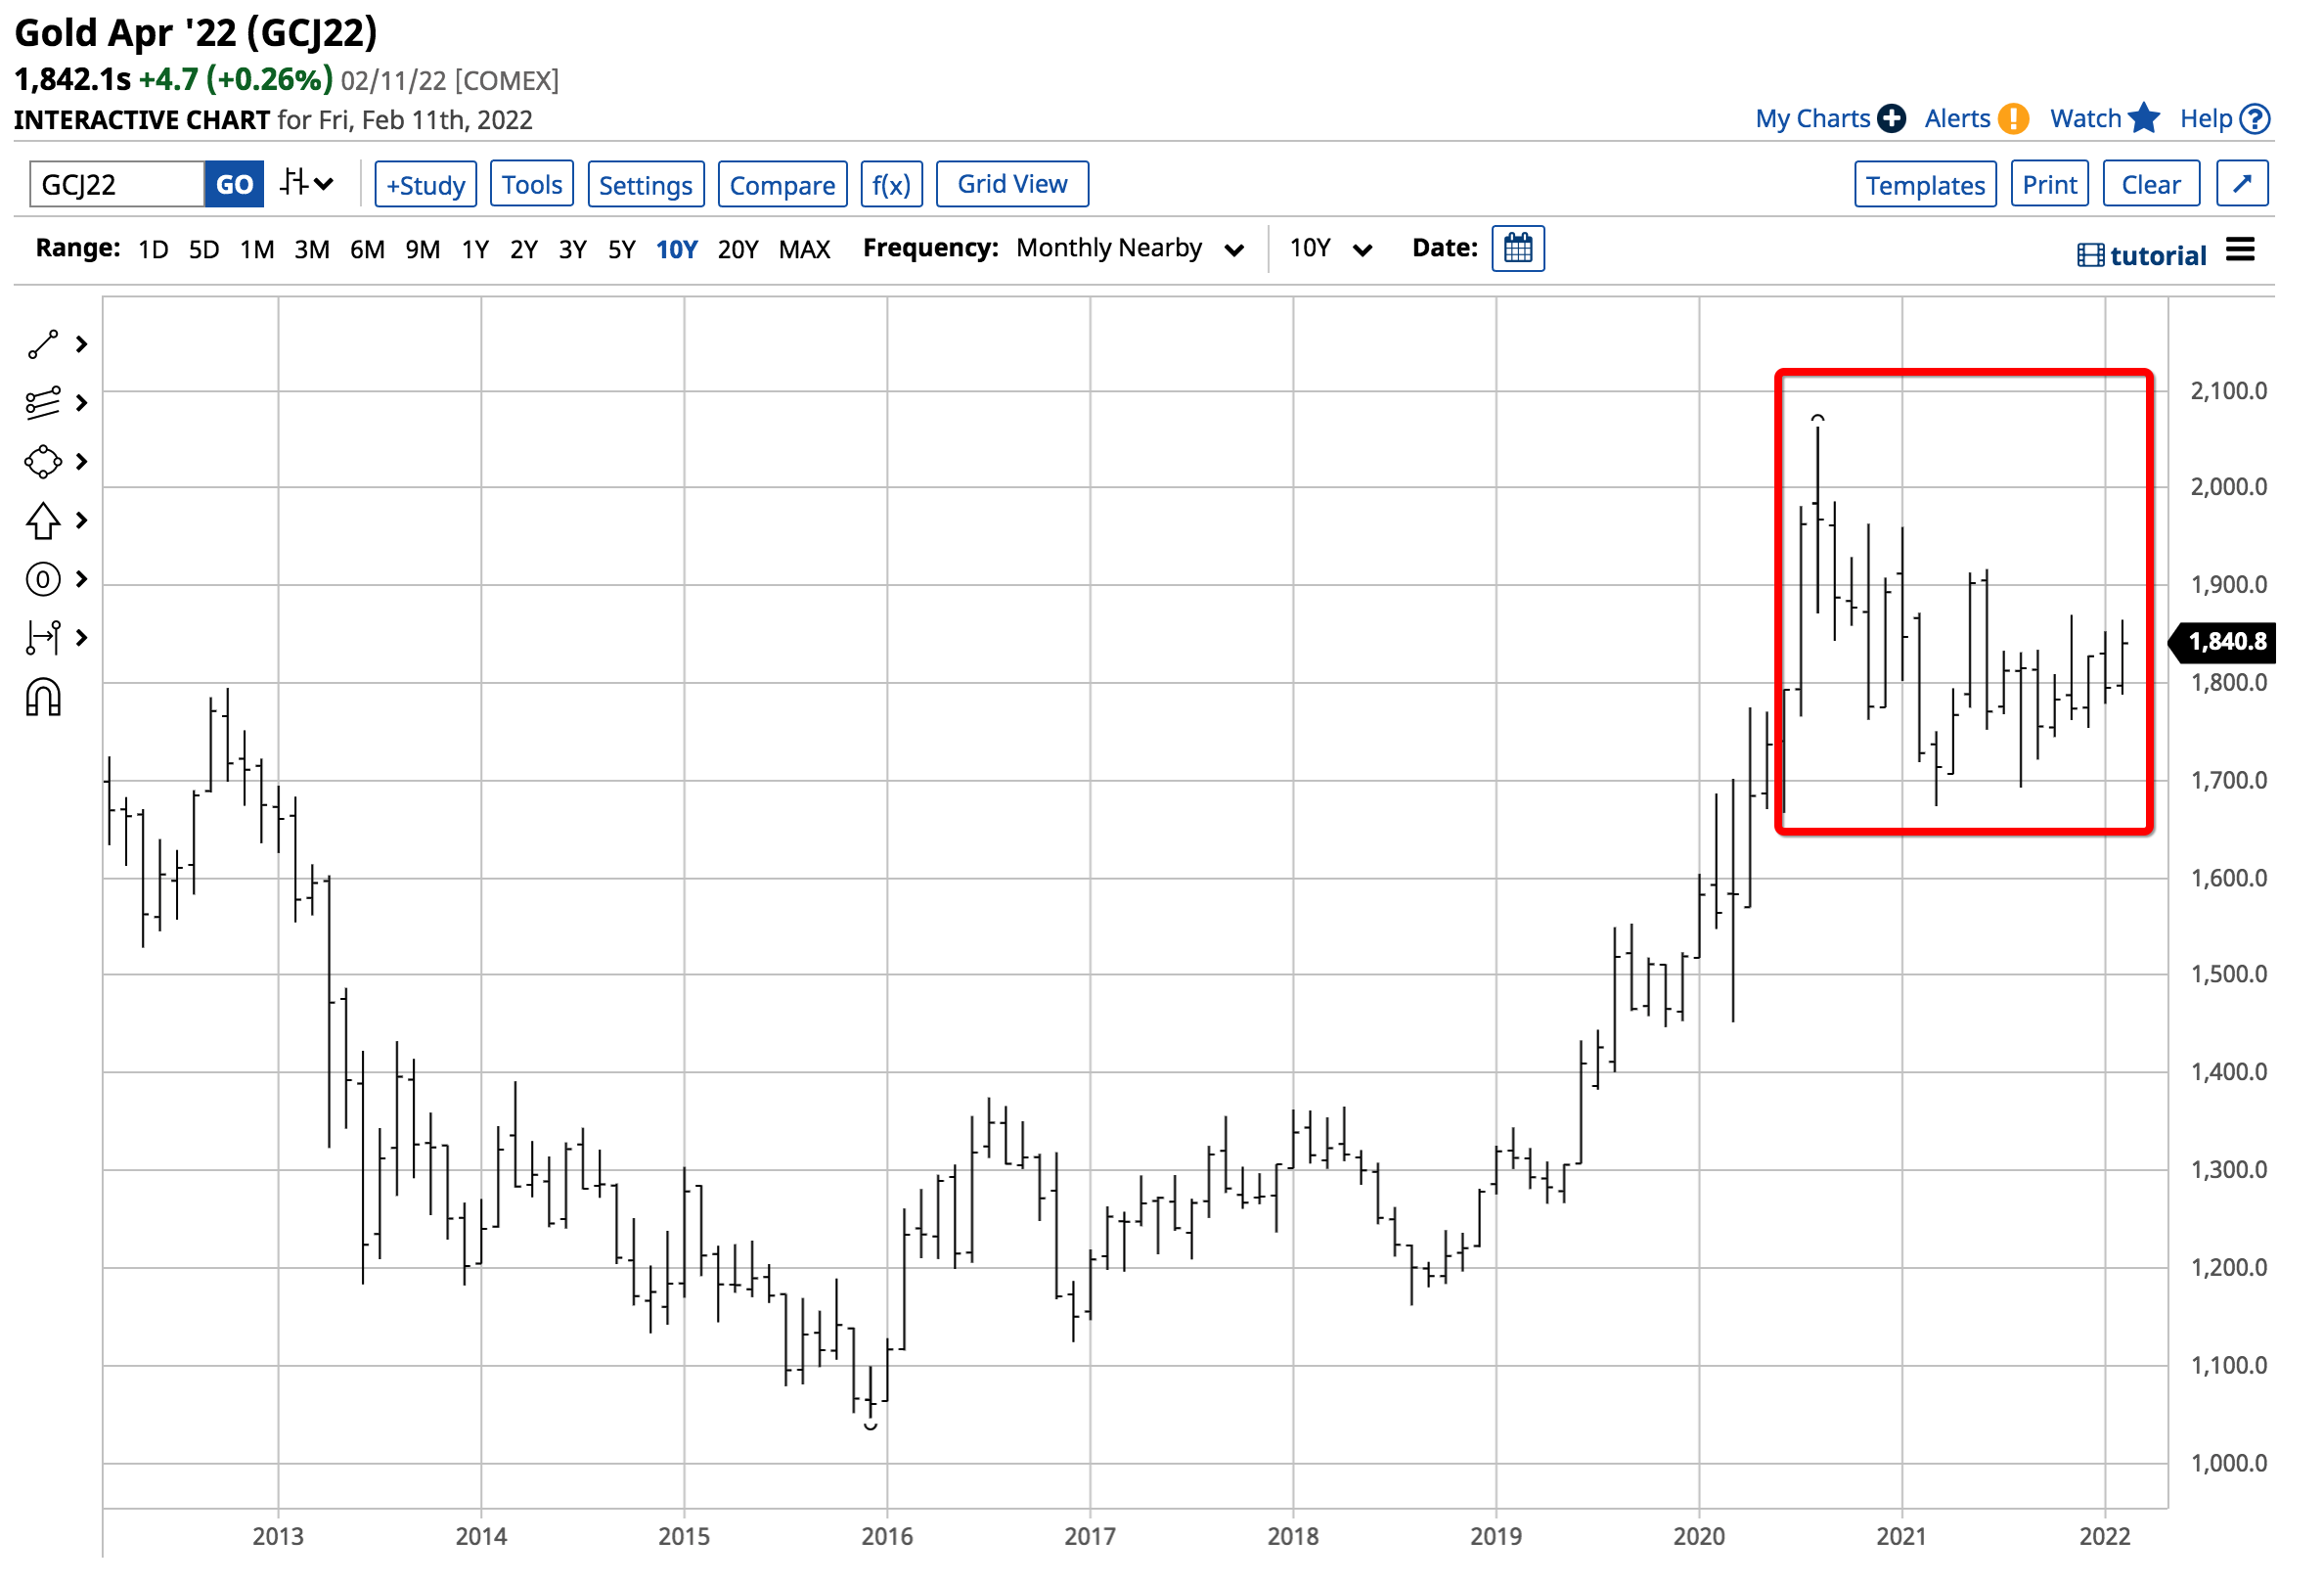
The chart shows that while the price action since August 2020 remains bearish and corrective, since March 2021, the gold futures market is building cause for a move higher. Rising inflation, uncertainty surrounding the geopolitical climate, and the long-term bull market in gold will likely lead a flock of buyers into the market if the price breaks above technical resistance, setting the stage for a move to another all-time high.
Gold could be set to move to a new all-time high in 2022
Since the turn of this century, every price correction in the gold market has been a buying opportunity.
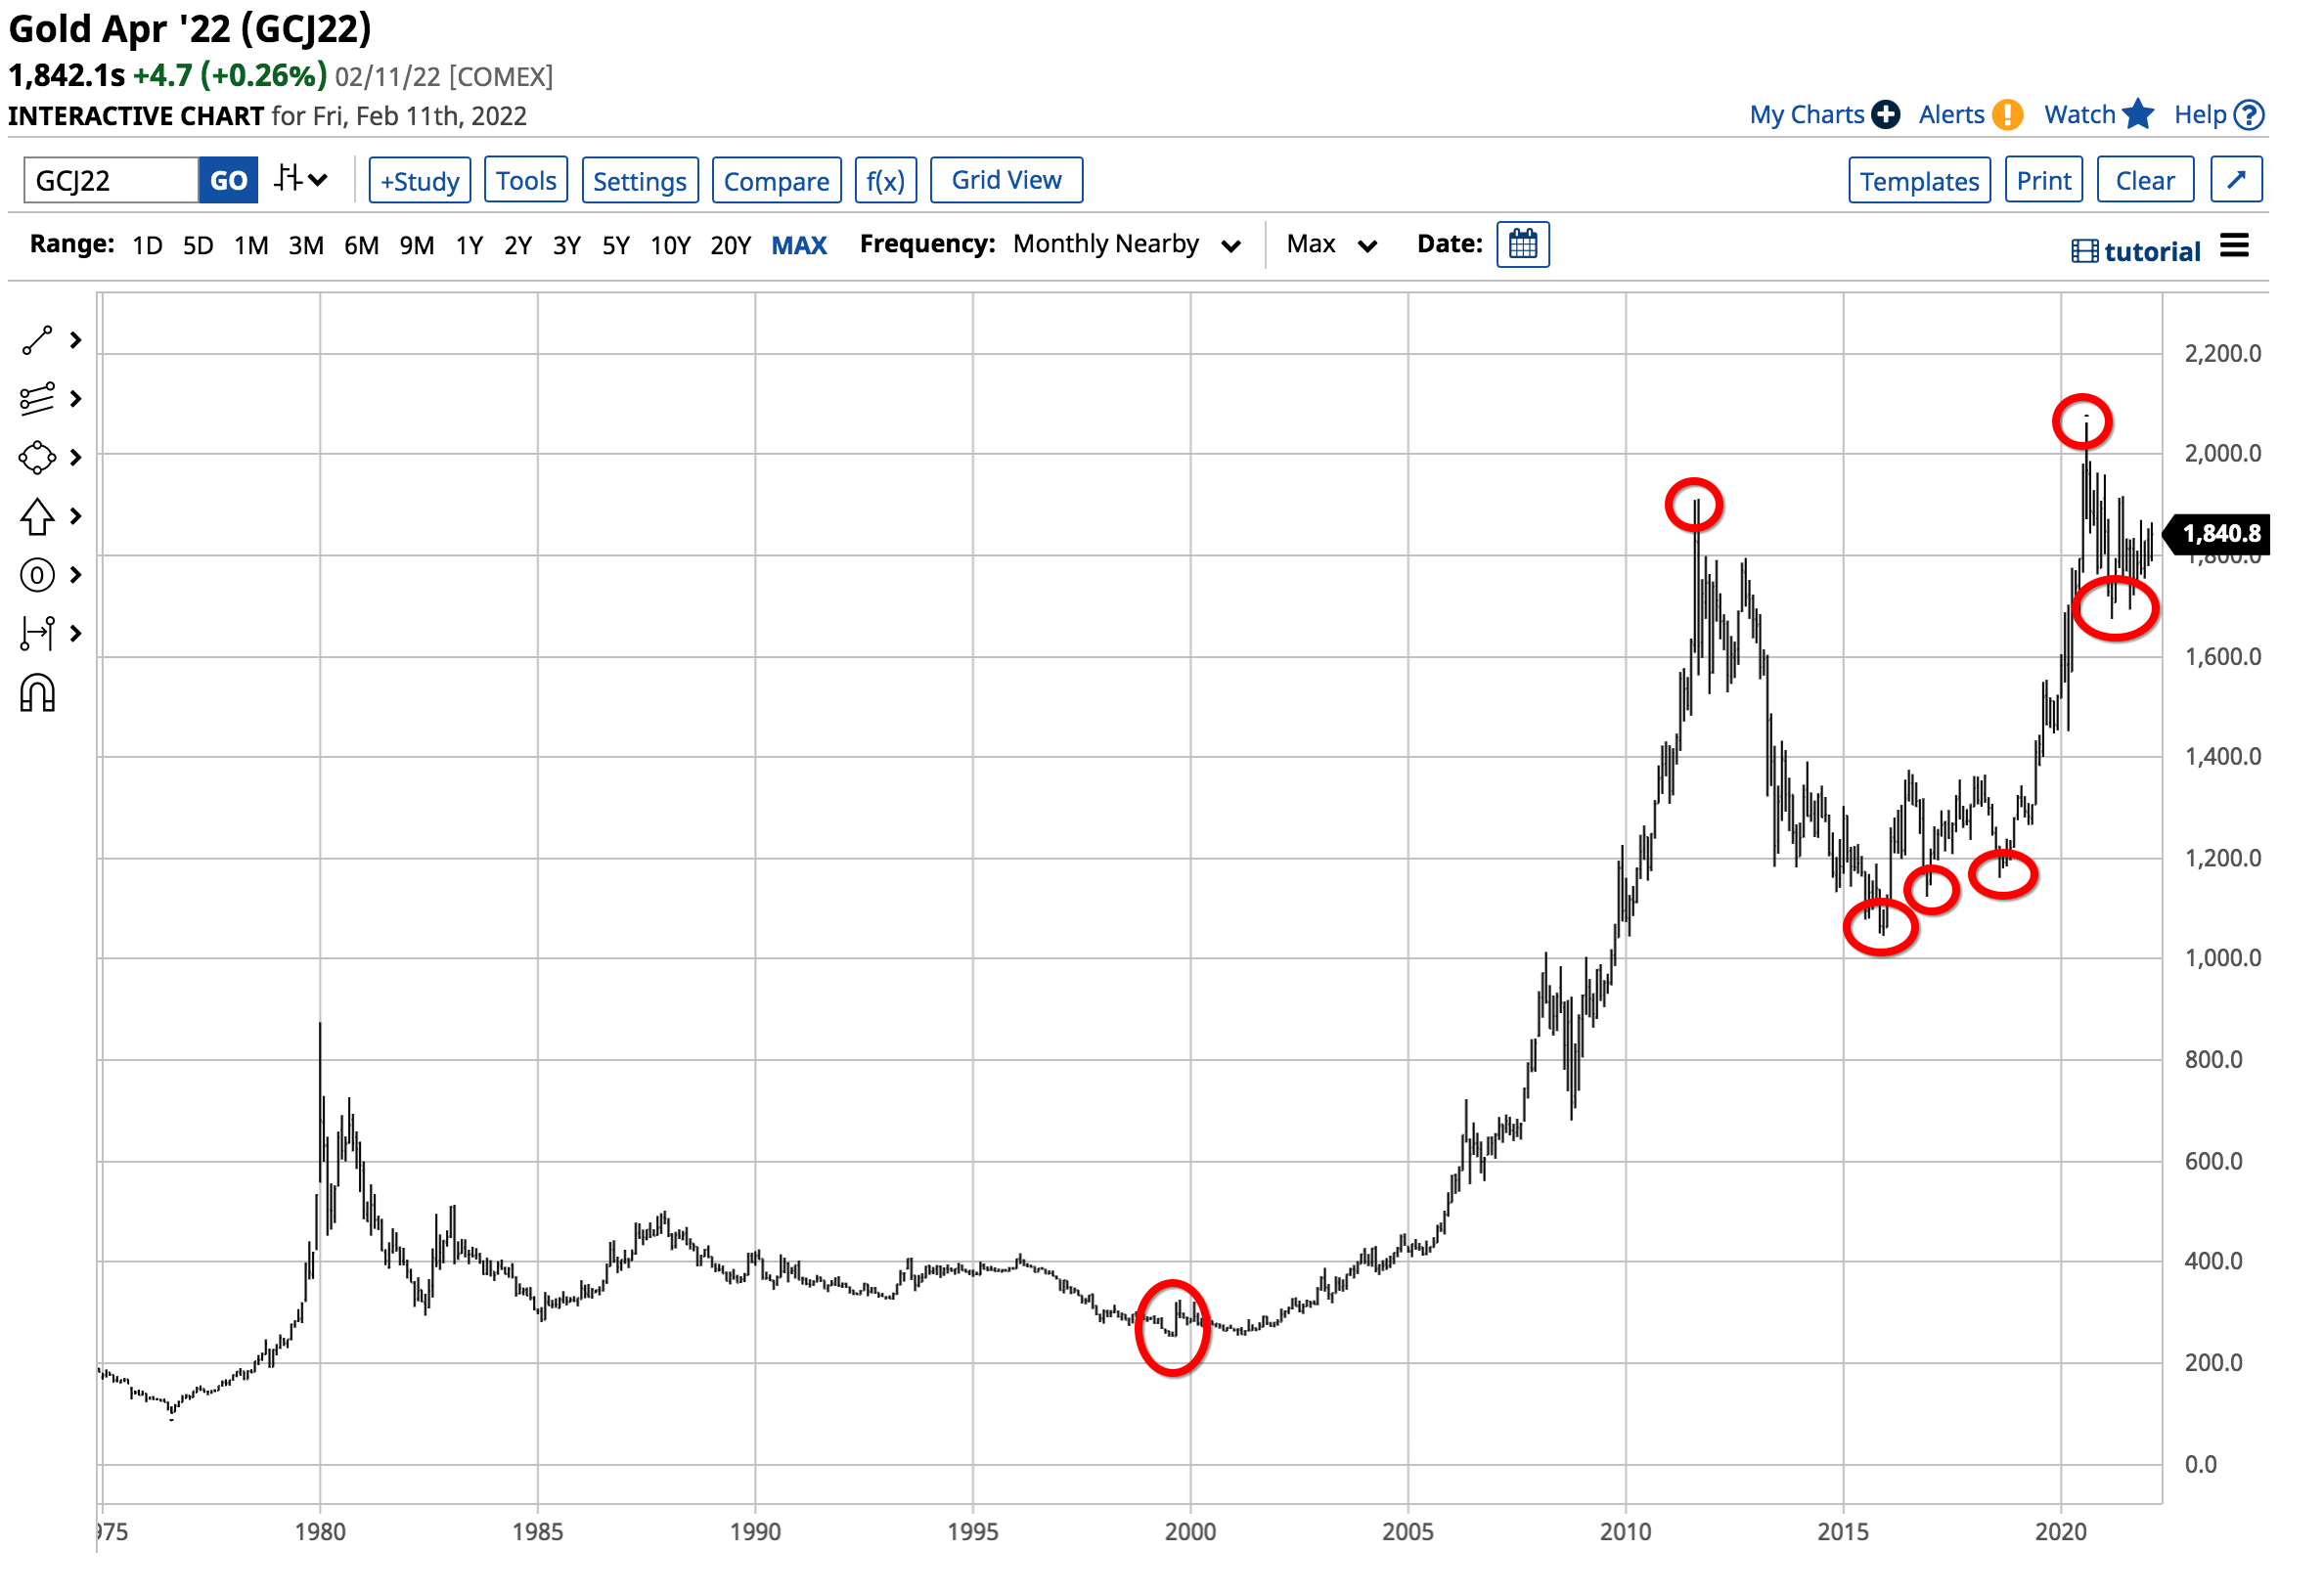
The long-term chart illustrates the move from $252.50 in 1999 and the pattern of higher lows and higher highs for over two decades. The trend has been choppy since the 2020 high and the March 2021 low, but the market has formed a wedge pattern that suggests a long-term cup-and-handle formation, which is a bullish consolidation period that leads to a breakout to the upside.
As of the end of last week, the technical resistance levels are at $1869.70 and $1916.60. Eclipsing those levels could lead to a substantial rally that challenges the August 2020 $2063 high and takes gold to much higher levels. The geopolitical tensions surrounding Ukraine cold trigger buying in the gold market over the coming days and weeks.


/A%20Palantir%20sign%20displayed%20on%20an%20office%20building%20by%20Poetra_RH%20via%20Shutterstock.jpg)