Chart of the Day
The information and opinions expressed below are based on my analysis of price behavior and chart activity
Sign Up to receive Walsh Trading’s 1st Half of 2026 Market Outlook First Half of 2026 Outlook for the Livestock and Grain markets.
Thursday, March 12, 2026
June Lean Hogs (Daily)
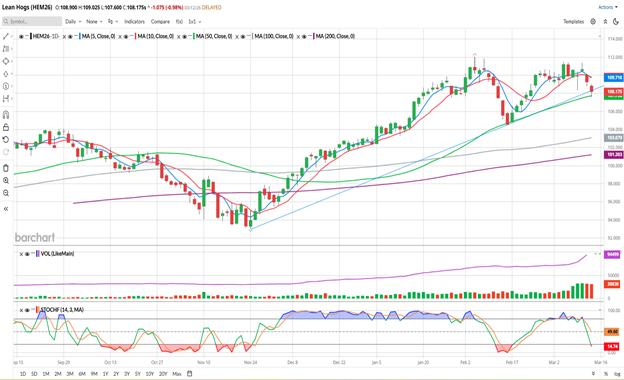
June Hogs closed at 108.175 today, dropping 1.075 from Wednesday’s settlement. Open Interest and Volume is moving from the April contract to the June, and June will be the most active contract for the next few months.
This market has been in an uptrend since roughly Thanksgiving and posted the contract high in early February. You may notice the drop in the middle of February from that high to the 50-day moving average, as the rally retraced some. The subsequent rally back up failed to set new highs and the market seems to have run out of bullish momentum over the past week or so. This market did post a new contract high close on March 4th, but so far this week the bears seem to be in control.
The 5- and 10-day moving averages have made a bearish crossover with today’s trade and are now offering potential resistance just shy of 110.000. Those averages are blue/red and are at 109.710 and 109.815, respectively. The 50-day average (green, 107.736) seemed to offer some support today, as did the blue trendline drawn off of the November and February lows. This is the 2nd time that the 50-day average has been tested since the market price crossed above it in December. The 100-day (grey, 103.079) and 200-day (purple, 101.203) are well below the market, offering potential levels of support. There’s also a price gap from Tuesday-Wednesday of this week, at Tuesday’s low of 110.325. Stochastics (bottom sub-graph) have turned lower and are lust getting into potential oversold status, but the market isn’t there just yet.
Aggressive and well-margined traders may do well to consider establishing short futures positions. Perhaps an entry at 108.350 with an initial protective buy stop at 110.350 would work for you. If that stop is triggered, it would result in a loss of $800 per contract, before your commissions/fees. For an exit target, try the 102.850 mark, for now. If that target is hit, that would result in a gain of $2,200 per contract, before your commissions and fees. Once the market closes below the 50-day average, you may wish to adjust your protective stop and follow the 5-day moving average, to potentially reduce your risk as the market moves lower.
Less aggressive traders, or those that prefer options the June Lean Hog Option expire in 92 days. The 100 Put settled at 1.625, or $650 per option before your commissions/fees. Look to exit that option at 4.875 or 3x what you paid for it. If that is triggered, it should result in a gain of 3.25 from what you paid, or $1,300 before your fees.
June Lean Hogs (Weekly)
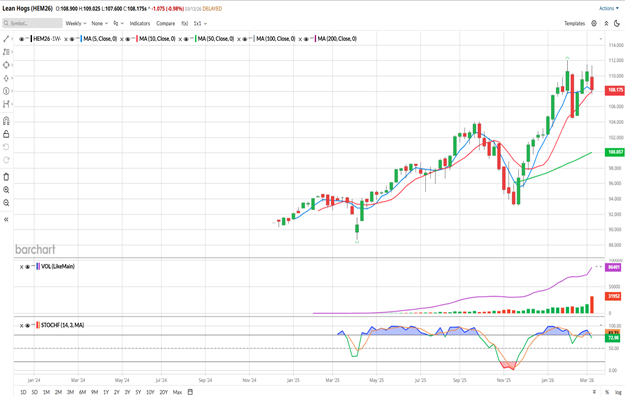
The weekly June Lean Hog chart indicates to my eye that this is a market that has been trending higher for most of its life. Most notably, it got weak at this time last year and again last fall from September to November. I think we may have another drop in price ahead of us. The 5- and 10-week moving averages (blue/red) are still in a bullish configuration and today’s settlement was just above them. Those averages are at 108.135 and 107.992, respectively. In the 5 weeks (bars) since the market posted the contract high at 112.025, price activity has been choppy. I think that when this market is trending, it tends to stay “on trend” which seems a bit different than recent trade. The 50-week average (green, 100.057) is still inclined toward higher prices and is offering potential support near the big, round number of 100.000. Stochastics (bottom sub-graph) are hooking lower and coming out of overbought status.
You can view Barchart’s Seasonal Data here. According to their data, over the past 15 years, June Hogs tend to go lower during March in 58% of those years and it’s a 50/50 proposition in April.
Sign Up to receive Walsh Trading’s 1st Half of 2026 Market Outlook First Half of 2026 Outlook for the Livestock and Grain markets.
If you like what you’ve read here and would like to see more like this from Walsh Trading, please Click here and sign up for our daily futures market email.
Jefferson Fosse Walsh Trading
Direct 312 957 8248 Toll Free 800 556 9411
jfosse@walshtrading.com www.walshtrading.com
Walsh Trading, Inc. is registered as a Guaranteed Introducing Broker with the Commodity Futures Trading Commission and an NFA Member.
Futures and options trading involves substantial risk and is not suitable for all investors. Therefore, individuals should carefully consider their financial condition in deciding whether to trade. Option traders should be aware that the exercise of a long option will result in a futures position. The valuation of futures and options may fluctuate, and as a result, clients may lose more than their original investment. The information contained on this site is the opinion of the writer or was obtained from sources cited within the commentary. The impact on market prices due to seasonal or market cycles and current news events may already be reflected in market prices. PAST PERFORMANCE IS NOT NECESSARILY INDICATIVE OF FUTURE RESULTS. All information, communications, publications, and reports, including this specific material, used and distributed by Walsh Trading, Inc. (“WTI”) shall be construed as a solicitation for entering into a derivatives transaction. WTI does not distribute research reports, employ research analysts, or maintain a research department as defined in CFTC Regulation 1.71.
/Nvidia%20logo%20and%20sign%20on%20headquarters%20by%20Michael%20Vi%20via%20Shutterstock.jpg)


/Intel%20Corp_%20Santa%20Clara%20campus-by%20jejim%20via%20Shutterstock.jpg)