- The new year has started off with a game of one-upmanship among market analysts to project the most times the US Federal Reserve will raise interest rates in 2022.
- According to the classic market cycle, this would lead to a peak in US stock markets.
- From a technical point of view, the three major indexes all look to be in position to establish, or have established, long-term tops.
We’ve reached the midpoint of January, and there is a consistency showing up on the long-term monthly charts[i] for the three major US stock market indices: the S&P 500 ($INX), Dow Jones Industrial Average ($DOWI), and Nasdaq ($NASX). To begin with the conclusion, like a stopped watch, those who have been bearish US stocks may finally be correct.
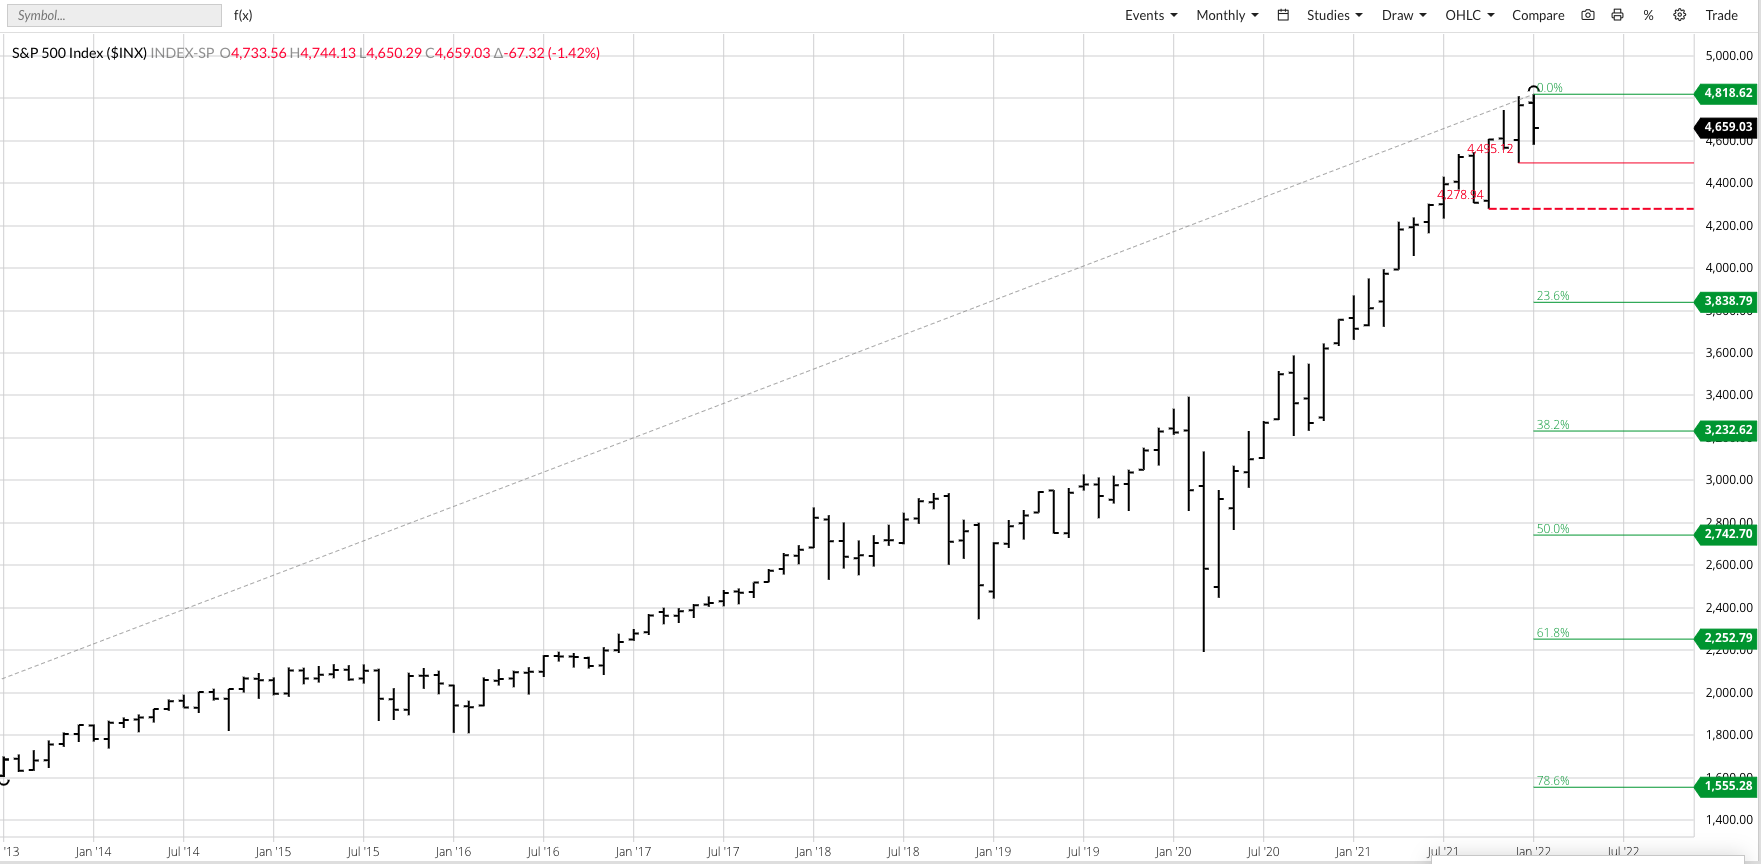
Starting with the S&P 500, the index extended its major (long-term) uptrend to a high of 4,818.62 on January 4. However, since then the $INX has been losing ground, falling to a low of 4,582.24 on January 10 before closing this week at 4,662.85. On its monthly chart the index is in position to post any one of the three bearish technical reversals I look for:
- A 2-month reversal: Closing near the monthly high one month and the monthly low the next.
- A spike reversal: Moving to a new high before closing lower for the month.
- A key reversal: Trading outside the previous month’s range before closing lower for the month.
Of these three, the key reversal is the most reliable, but the $INX would need to fall below the December low of 4,495.12 to complete this pattern. Beyond that, initial support is at the previous 4-month low of 4,278.94 from this past October.
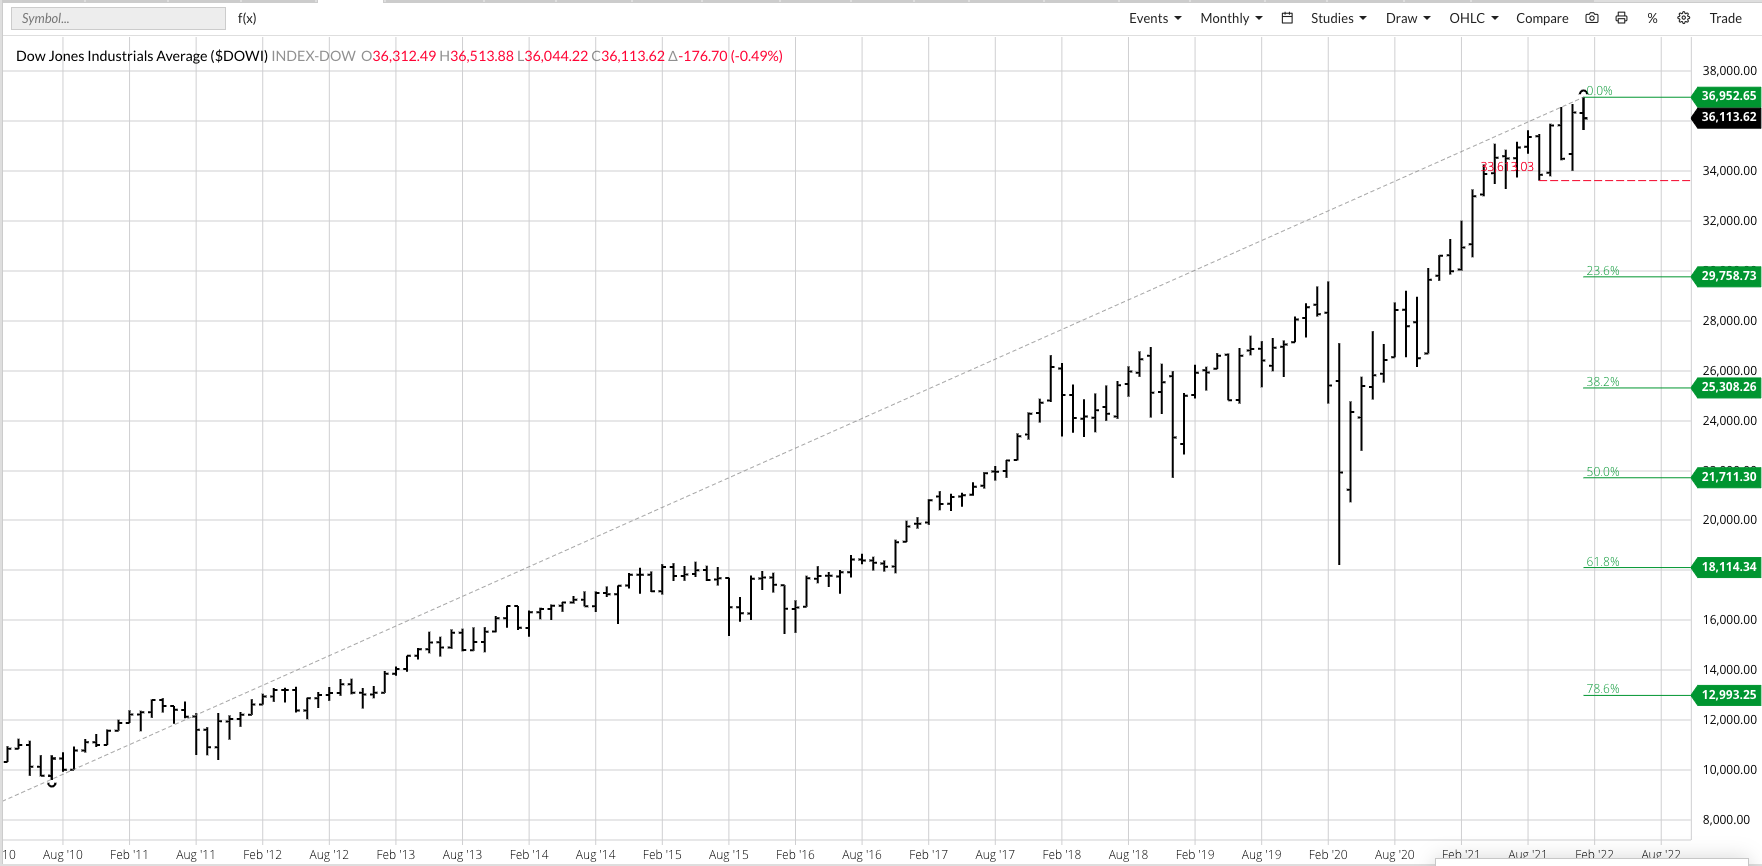
The $DOW is also in position to complete a bearish reversal pattern, though here a key reversal seems unlikely as it would have to drop below the December low of 34,006.98. While this isn’t impossible, it doesn’t look probable either. Then again, who knows what might happen if Russia decides to invade Ukraine during the last half of the month. Still, even if the $DOW doesn’t complete a key reversal, either of the other two remain strong possibilities. If the major trend turns, initial support is at the 4-month low of 33,613.03 from last September, and that seems a long way down.
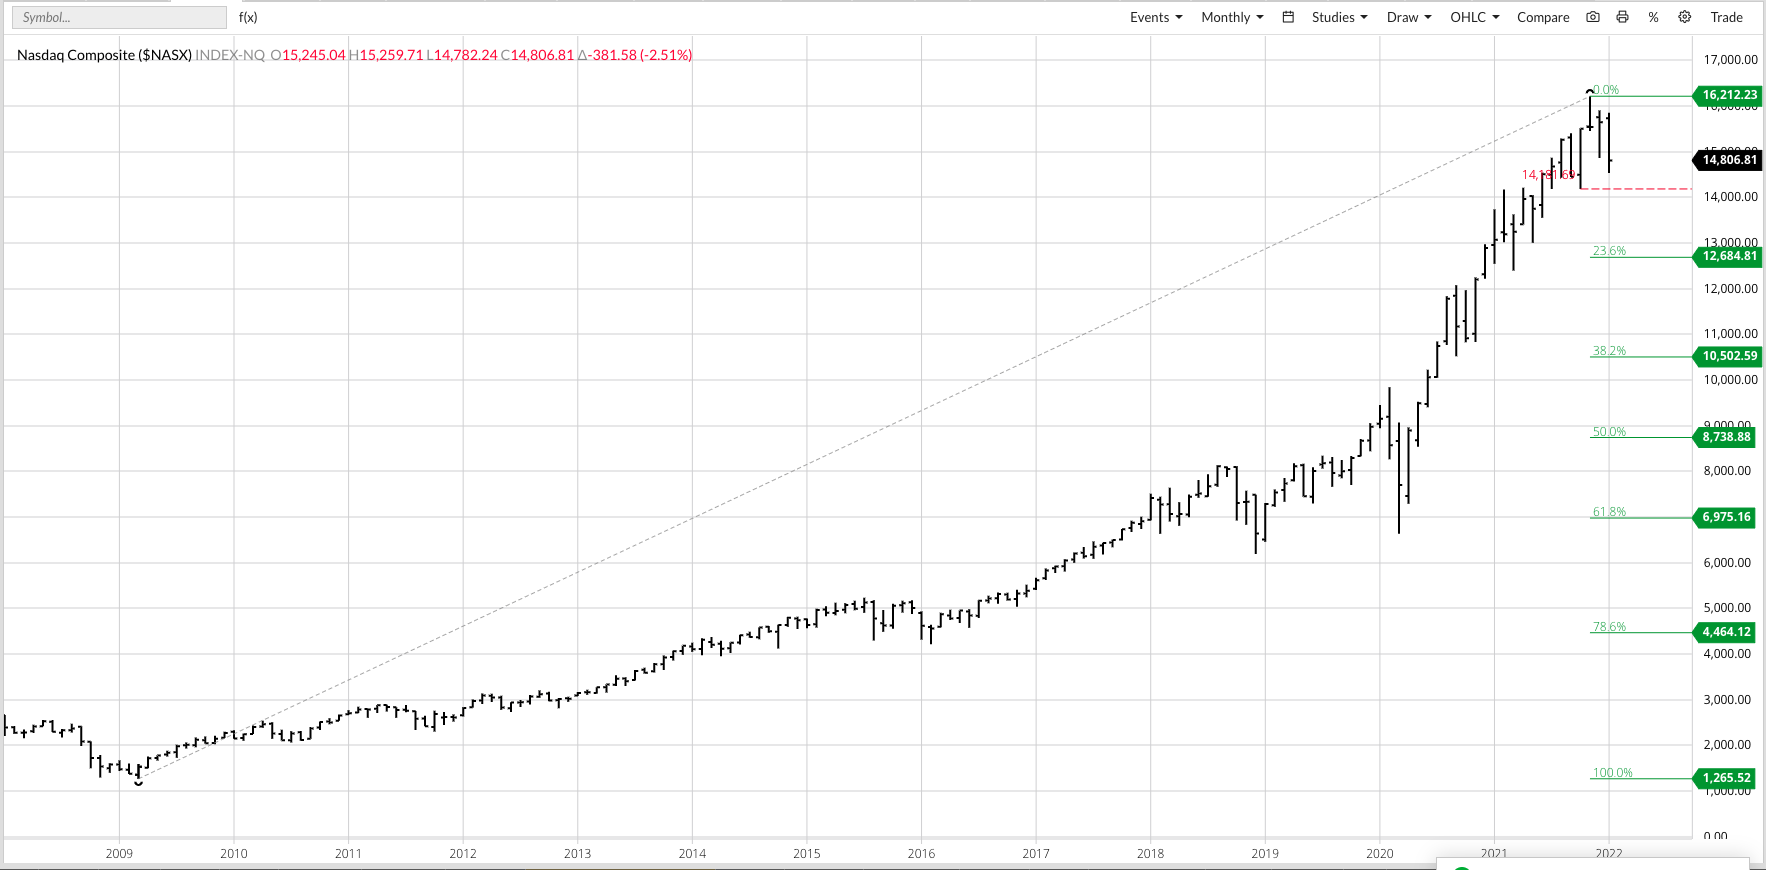
I talked about the minor (short-term) trend of the $NASX this past Monday, but that bullishness looks to be short-lived as the index already seems well on its way toward confirming a major downtrend. Here, though, the reversal pattern isn’t quite as clear, unless we apply the Horseshoe Proximity[ii] to this past November’s activity. Here we see the $NASX hit a new high of 16,212.23 before erasing nearly all its monthly gains, closing the month at 15,537.69, up 39.30 from October’s settlement. If we consider that far enough off the monthly high to be considered a lower monthly close, then the index posted a bearish spike reversal. If not, we are still waiting for tech stocks to confirm a major downtrend with a new 4-month low below October’s 14,181.69.
Again, we are only halfway through the month so nothing is set in stone. But with market chatter now about the US Federal Reserve possibly raising interest rates anywhere from 3 times to 7 times (yes, I’ve seen where this was projected), the classic market cycle outline tells us stocks should peak and turn down.
[i] Yes, I know I usually apply the Goldilocks Principle when it comes to monthly charts. The Goldilocks Principle tells us, “Daily charts are too hot, monthly charts are too cold, but week charts are just right.” However, when it comes to stock markets and long-term investment opportunities, it’s good to know the major (long-term) trend of any market.
[ii] There are no absolutes in market analysis (and yes, I get the irony of saying “no absolutes”), with the Horseshoe Proximity telling us “close is close enough.”


/Technology%20abstract%20by%20TU%20IS%20via%20iStock.jpg)