



/Engineer%20in%20Sterile%20Coverall%20Holds%20Microchip%20with%20Gloves%20and%20Examines%20it%20by%20Gorodenkoff%20via%20Shutterstock.jpg)
While NXP Semiconductors (NXPI) may be a strong business overall, its recent severe underperformance has left many questions regarding forward viability. Over the trailing month, NXPI stock has lost roughly 19%, thus leading to a very modest year-to-date performance of just under 4%. Fundamentally, the chipmaker — which is heavily exposed to the Chinese auto market — may be facing broader economic challenges. Still, the weakness could offer a contrarian opportunity for bold speculators.
On paper, circumstances would seem optimistic. In the company’s second-quarter earnings report, it exceeded headline metrics. According to Google Finance’s summary sheet, NXP reported record non-GAAP earnings of $3.61 per share and revenue of approximately $3.50 billion, thus resulting in 19.5% growth year-over-year. Contributing to the strong print were accelerating adoption of software-defined vehicles and expanding physical AI infrastructure applications.
Unfortunately, the market was skeptical about the future trajectory of NXPI stock, especially due to auto industry concerns. Analysts raised alarm about global inventory risks stemming from a potential slowdown in China, along with other macroeconomic headwinds. Such anxieties aren’t exclusive to NXP, with the wider chip industry experiencing selling pressure.
At the same time, the counterbalancing argument is that China is aggressively transitioning to electric vehicles. This macro tailwind should help lift NXP’s semiconductor value per car significantly. Therefore, it’s not a foregone conclusion that NXPI stock will be permanently stuck with a technical sell rating.
What’s more, the current quantitative structure of NXPI is quite unique. In the last 10 weekly sessions, the ticker has only managed to print two positive candlesticks, leading to an overall downward slope. Under this 2-8-D quantitative sequence (2 up, 8 down, downward slope), the market tends to generate a positive forward bias for NXPI stock.
How much of a bias? Well, there’s an inductive reason why I’m looking at the 250/260 bull call spread expiring Oct. 16.
Multiple Presuppositions Battle for NXPI Stock
To be fair, when you look at the forecasted stats for the 250/260 call spread, they don’t exactly inspire confidence. For one thing, you would need serious juice for NXPI stock to rise about 15.3% from Friday’s close to trigger the second-leg strike price, which would result in a 104.08% maximum payout. However, the current implied volatility (IV) for the Oct. 16 options chain is 42.67%, whereas the historic volatility for the period is 43.61%.
Why is that a problem? IV metrics stem from actual orders. Therefore, if market participants’ various transactions imply less-than-historical expectations for share price movement, expecting a move of over 15% over the next eight weeks seems extremely (perhaps unreasonably) optimistic.
In fact, this is a big reason why the probability of profit is listed at 23%. Nominally, there’s a very low chance that NXPI stock will hit $254.90 at expiration, let alone the $260 strike. And what about the strike? If you reverse engineer Barchart’s Expected Move calculator, you’re looking at a probability of only 18.93%.
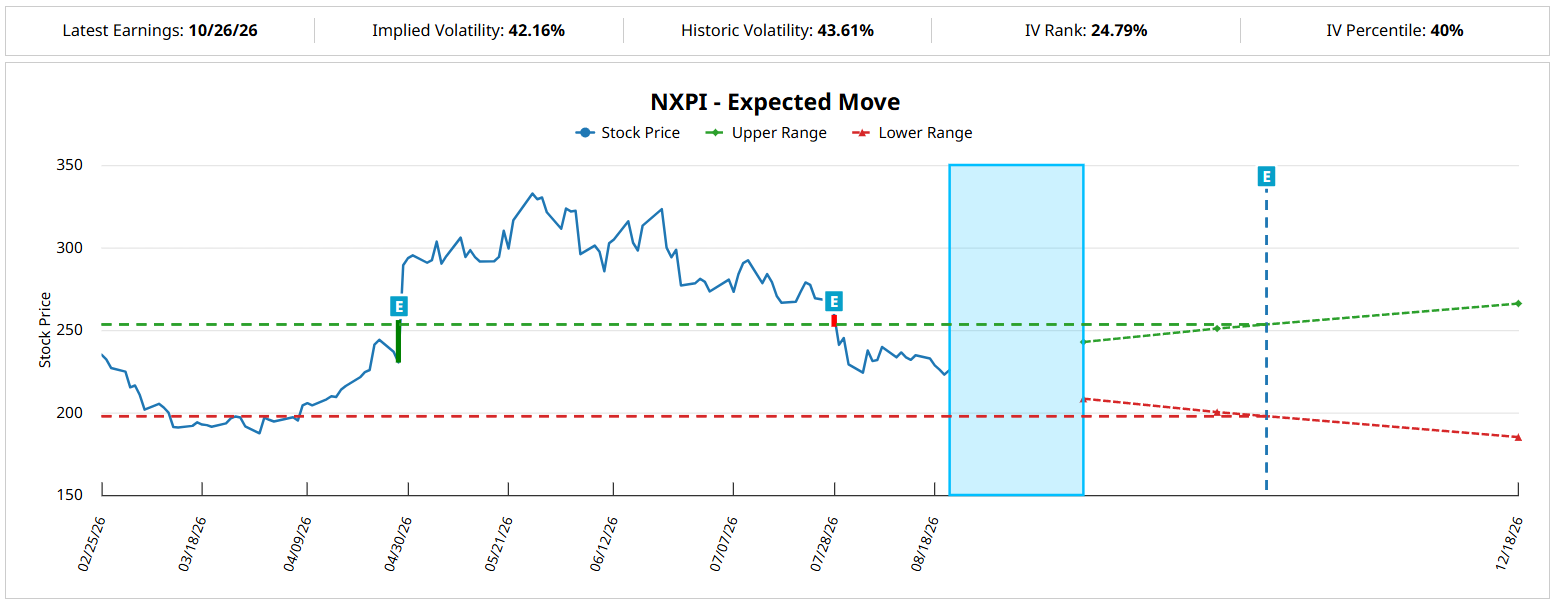
So the conclusion is rather obvious: if we were to accept the above odds as absolute truth, then the NXPI stock call spread would be completely reckless. The question, though, is whether or not the odds provided are indeed absolute truth?
Here’s the harsh reality: from an epistemological framework, we can know absolutely nothing about the unknown future. Even concepts like “before and “after” are presuppositional. Just because these concepts existed throughout deep time does not necessarily mean we can rely on them with absolute certainty.
Now, I’m not going to suggest that “tomorrow” will not come. From a more practical view, at the heart of the above probabilities is the concept of the random walk. For example, the idea that NXPI stock hitting $260 on Oct. 16 representing only an 18.93% chance didn’t come out of nowhere. Instead, these are the legitimate odds if, given the initial IV, NXPI incurred Brownian motion (i.e. random trading dynamics) from now until expiration.
My presupposition, though, is that because NXPI stock suffers from a sharply negative order flow balance, it will likely incur a nonrandom journey. Under this framework, I believe the odds — while not particularly “good” — are higher than what would be assumed under random conditions.
Detailing the Inductive Math Behind NXP Semiconductor Stock
The question now becomes, why did I specifically look at the 250/260 bull spread expiring Oct. 16? Essentially, of the rare few times that we’ve seen the 2-8-D quant sequence flash since January 2019, NXP Semiconductor stock has delivered an impressive upside performance.
By the raw count, the above signal has flashed 12 times on a rolling basis. Of this figure, NXPI stock has exceeded the equivalent of the $260 strike a total of six times at the end of the eighth week (Oct. 16) following the signal materializing on the charts. Granted, we’re talking about an extremely small sample size but so far, the observed condition probability of full profitability is 50%.
In other words, if we gamble that this bullish trend were to repeat in the future, the median endpoint expectation on Oct. 16 is a price of around $260. If so, that may be enough to trigger the second-leg strike, thus resulting in a robust payout.
It must be acknowledged, though, that this framework is a matter of inference, not logical necessity. There’s no guarantee that NXP Semiconductor stock will reach $260 at expiration. Also, since we’re dealing with a limited sample size, it’s not possible to have high statistical confidence.
At the same time, I’m not entirely convinced that NXPI stock will undergo a random walk into October. Because the order flow balance is so negative, I’m betting on major players looking at the quantitative weakness of NXPI as a discounted opportunity.
On the date of publication, Josh Enomoto did not have (either directly or indirectly) positions in any of the securities mentioned in this article. All information and data in this article is solely for informational purposes. For more information please view the Barchart Disclosure Policy here.




/Alibaba%20by%20Photo%20Agency%20via%20Shutterstock.jpg)
/An%20Intel%20sign%20out%20front%20of%20a%20corporate%20office%20by%20wolterke%20via%20Adobe%20Stock.jpeg)