




I’m not here to offer a long-term contrarian case for Nike (NKE). That’s going to be really hard to do, considering that the Barchart Technical Opinion indicator rates NKE stock as an ignominious 100% Strong Sell. Also, you just have to look at the facts. The ticker is down almost 39% — that’s for a reason and not a good one.
A quick look at Google Finance’s summary sheet reveals a sector-wide slowdown, alongside analyst downgrades and management shakeups. Wall Street experts project that Nike will incur sustained pressure next quarter, with flat earnings and soft demand imposing headwinds on turnaround efforts. Plus, you got to figure that the current economic situation isn’t helping much.
There are other concerns but I’m not going to waste airtime on matters that are already deeply priced into NKE stock. Let’s talk about the current situation. If you were looking at a weekly technical chart, over the last 10 sessions, NKE has managed to ink only two positive candlesticks.
If you’re thinking that’s a rare quantitative sequence of events, you’d be right. Running an algorithm on the historical data of Nike stock reveals that this sequence has materialized only 39 times on a rolling basis since January 2009. This represents 4.33% of the 901 rolling 10-week sequences that have occurred since then.
By itself, this 2-8-D (2 up weeks, 8 down weeks, downward slope) sequence is just a statistical anomaly, a factoid if you will. But it’s what happens after this signal flashes in the charts that’s most intriguing. Typically, when market participants see this signal, the response is a buy-the-dip sentiment.
Now, I’m not suggesting that this uptrend is guaranteed. As with anything in the non-determinative equities market, you can’t calculate a precise, absolute trajectory. But you can look at the odds and that’s why, for bullish speculative traders, Nike stock should be on the radar.
Extreme Negativity May Be a Saving Grace for NKE Stock
To say that the broader opinion for Nike stock is negative would be an understatement. Consider the upcoming Aug. 28 options chain, specifically the 39.50/40 bull call spread. NKE needs to rise 2.33% at expiration to trigger the $40 strike. Doing so would mean a profit of $29 off a $21 net debit (initial cash outlay to enter the trade).
Because NKE stock is a blue chip, a 2.33% rise in two weeks is an aggressive but arguably workable proposition. But under current conditions, relatively few participants have such optimism, at least as evidenced by the protective posture of the Aug. 28 volatility skew.
Perhaps the best indicator of the pessimism toward NKE stock is Wall Street’s probability distribution. Under its framework, the odds of NKE hitting $40 on Aug. 28 is 37.13% — a figure that can be extracted by reverse engineering Barchart’s Expected Move calculator. In addition, the probability of the 39.50/40 bull spread breaking even is only 39.4%.
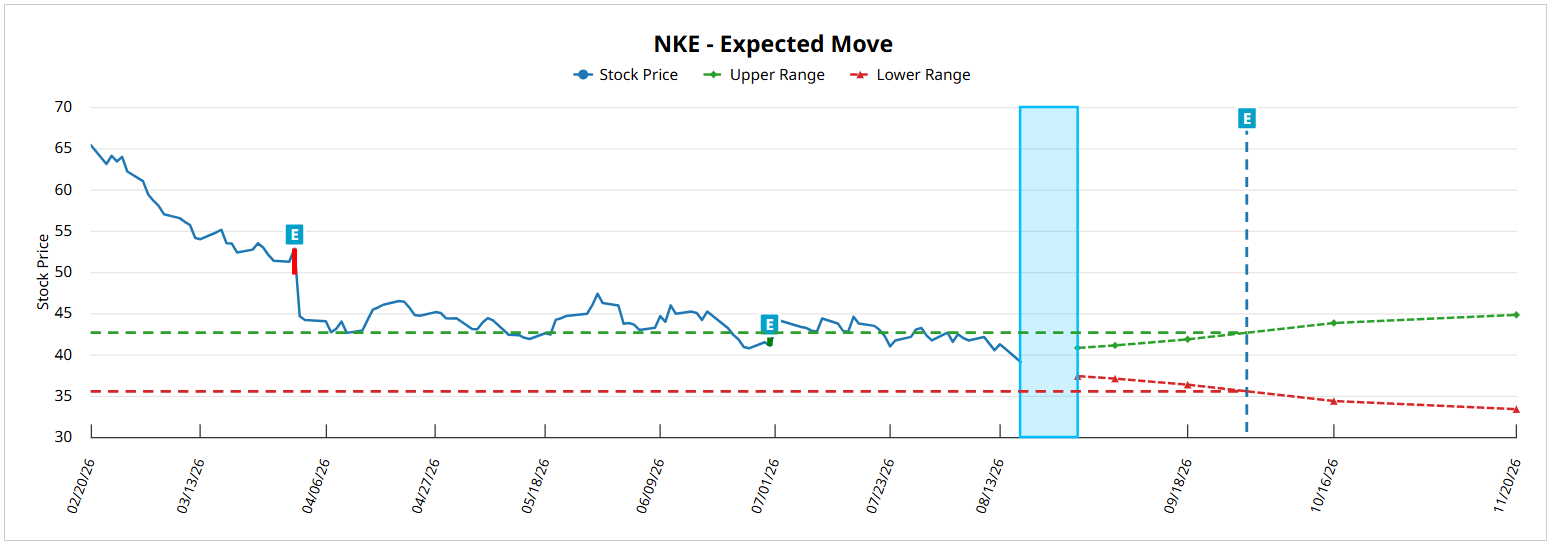
With odds this low, is it worthwhile to even consider Nike stock on the long side? I believe it is but it would have to involve a different set of presuppositions.
Without getting into the complexities of the math, the probabilities above are implied based on a random walk framework. In other words, if NKE stock traversed randomly from the current starting point to the Aug. 28 expiration date with an initial implied volatility (IV) of 33.57%, you would expect to hit $40 about 37% of the time.
However, the historical data shows that when Nike stock flashes a 2-8-D sequence, the resultant trajectory is not random but positively nonrandom. In scientific language, the test group tends to perform better than the control group.
How much better, you might ask? In the second week following the flashing of the aforementioned signal, NKE stock rises above the equivalent of the $40 strike a total of 21 times. This means that by the Aug. 28 expiration date, there is a projected success ratio of 53.8%.
Positive EV Under Nonrandom Presupposition
Based on a random walk outlook, the 39.50/40 bull spread will have negative expected value (EV). Over the theoretical long run, playing this exact trade under the exact scenario will likely lead to a nominal win value of $10.77. However, the losses will amount to $13.20, thus generating a net loss of $2.43.
On the other hand, if you assume that NKE stock will enjoy a nonrandom walk — as defined per the above collected data — the trade would likely enjoy positive EV. If my calculations are correct, you’d be looking at a net gain of $5.90 over the theoretical long run.
Of course, there’s a lingering question about why my presupposition should be more privileged than Wall Street’s presup — and to be frank, there is no objective case to demonstrate privilege. It just comes down to what the trader ultimately finds convincing.
Personally, I’m convinced that severely bearish order flow imbalances lead to reactionary responses by the market, thus making the forward outcome nonrandom by default. I would find it more incredible that Nike stock would continue to trade like a random walk even after such a severe downfall.
If you also believe in this conditional nonrandomness, the $40 target over the next two weeks, while admittedly aggressive, appears to be rational.
On the date of publication, Josh Enomoto did not have (either directly or indirectly) positions in any of the securities mentioned in this article. All information and data in this article is solely for informational purposes. For more information please view the Barchart Disclosure Policy here.

/Oracle%20Corp_%20office%20logo-by%20Mesut%20Dogan%20via%20iStock.jpg)

/AI%20(artificial%20intelligence)/Close-%20up%20of%20computer%20chip%20with%20AI%20sign%20by%20YAKOBCHUK%20V%20via%20Shutterstock.jpg)

/A%20close-up%20shot%20of%20the%20Taiwan%20Semi%20logo%20on%20a%20corporate%20building%20by%20Jack%20Hong%20via%20Shutterstock.jpg)