
Sirius XM (SIRI) has been far removed from being labeled as a solid investment, with SIRI stock losing more than 15% in the past 52 weeks. Over the past five years, the security stumbled about 67%, unsurprisingly earning it the dubious status of 100% Strong Sell rating from the Barchart Technical Opinion indicator. In the last three years, the platform’s Top Trade Alerts have issued only two Buy signals for the stock.
However, what’s curious about the company is its performance in the new year. Granted, it’s only been a month so there’s really no point in getting too excited. Still, SIRI stock finds itself up nearly 2%, which, while hardly anything to write home about, does represent a stark contrast to many other tech names. With the company scheduled to release its earnings on Thursday, there’s legitimate excitement about an unexpected beat.
First, we can look at volatility skew, which identifies implied volatility (IV) or a stock’s potential kinetic output across various strike prices of the same expiration date. For the Feb. 20 options chain, a full smile has materialized for the put IV curvature. With puts elevated at both ends of the strike price spectrum (and above call IV), this structure implies a heavy prioritization of downside insurance.

Essentially, you can think of the options market as an ecosystem to purchase volatility insurance, either to the downside or the upside. With SIRI stock, the understandable fear is that the security could collapse. What’s important to point out, though, is that “full smile” effect is also evident for call IVs as well.
No, the demand for calls is relatively lower than the demand for puts; therefore, the dominant motif remains protection against downside exposure. However, the upward curvature in call IV indicates upside optionality. Simply stated, the smart money is communicating that there is a non-trivial possibility of an earnings beat.
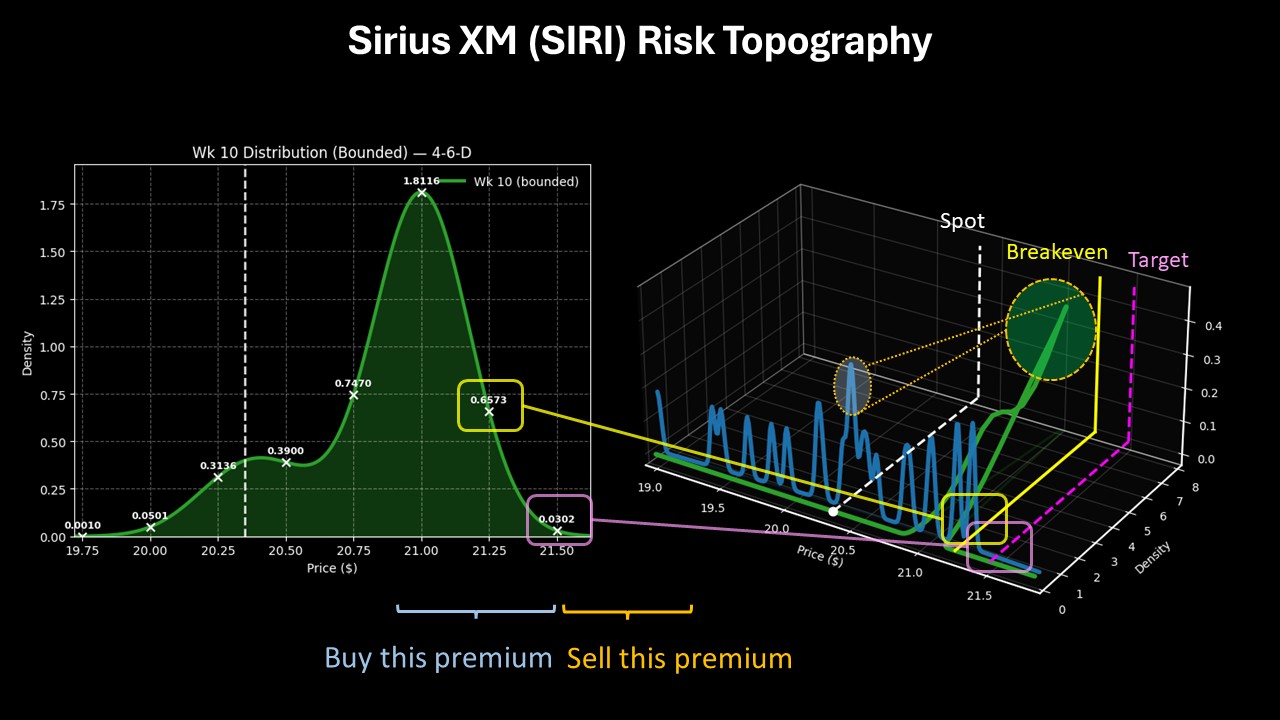
I almost have to throw this in there because volatility skew is central to this article but options flow — especially in the last half of January — shows relatively strong inflows into SIRI stock. Some of the biggest trades are targeting the $21 and $21.50 calls expiring this Friday.
Keep this range in mind because it’s about to get really interesting.
Leveraging the Utility of a Second-Order Analysis for SIRI Stock
Now that we understand the structural bias of the smart money, what’s the potential output for SIRI stock? We can ascertain the parameters of the battlefield with the Black-Scholes-derived Expected Move calculator. Under this model, SIRI stock at the end of the Feb. 20 expiration date should land somewhere between $18.88 and $21.82, which represents a 7.23% high-low spread from the current spot price.
Where did this dispersion come from? Black-Scholes assumes that stock price returns are lognormally distributed. Under this assumption, the aforementioned range represents where SIRI stock would symmetrically fall one standard deviation away from spot (while accounting for volatility and days to expiration).
Without getting bogged down with the math, Black-Scholes is saying that in 68% of cases, we would expect SIRI stock to land between roughly $19 and $22 on Feb. 20. While this parameter is both credible and insightful (because the numbers are derived from actual order flows), the challenge is that we have a list of possibilities. But buying a debit strategy to cover this absolute spread of 16% can get awfully expensive.
So, what is the solution? One idea that I thought of is to essentially apply Black-Scholes to Black-Scholes. The crux of the model is that volatility is calculated as an independent input, which is why Expected Move calculations are perfectly symmetrical. Again, since we can’t always buy a debit strategy to cover the entire symmetry, we need some system to narrow the list of possibilities into a list of probabilities.
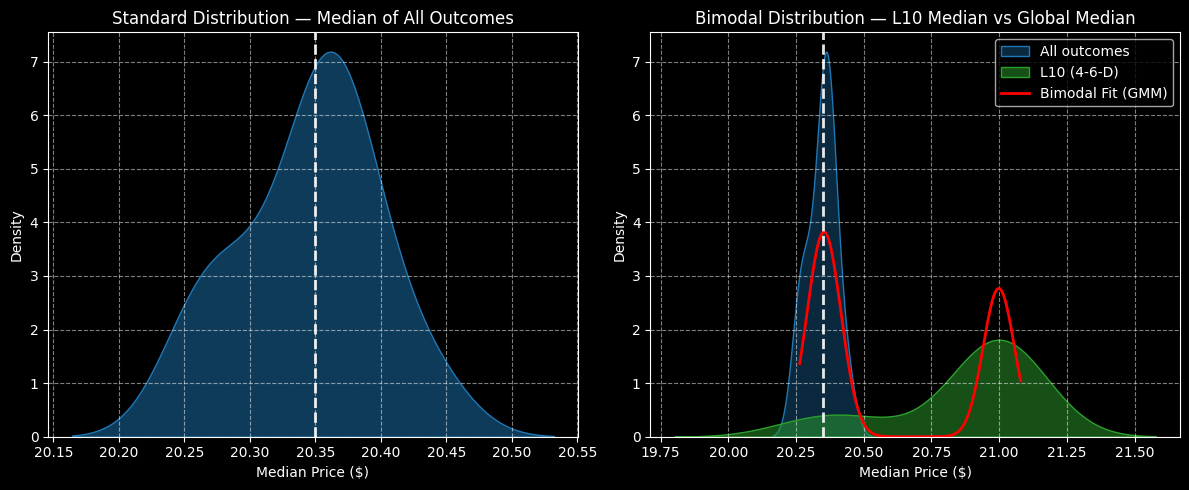
This is where the Markov property enters the frame. Markovian analyses treat volatility as a dependent input. Dependent on what, you might ask? Dependent on the quantitative structure of the security. How SIRI stock is structured entering into our frame will have an influence on its forward trajectory.
Right now, in the past 10 weeks, SIRI stock has printed only four up weeks, leading to an overall downward slope. Under this 4-6-D sequence, we would not expect SIRI to navigate the technical charts lognormally. Instead, we would anticipate a “jumping” effect where probability mass would converge toward the $21 price point over the next several weeks.
Now, we have a defined target to aim at rather than a surface area 16% in width.
Reading Between the Lines
To be quite blunt, SIRI stock is stupidly speculative. What adds to the perplexing nature is that SIRI isn’t a good deal, even though it lost more than 15% of value in the past 52 weeks. Remember, just because a stock loses a lot of value in the open market doesn’t necessarily mean that it’s cheap in the derivatives market.
In this case, as I mentioned with volatility skew, the smart money is prioritizing both downside protection and upside optionality. That means the calls are actually going to be quite expensive, even though you’re acting in a contrarian manner relative to open-market traders.
Still, for me, there are two clear positives that help us reduce uncertainty from an information theoretic standpoint. First, the smart money has objectively bid up upside optionality — that’s straight from Wall Street’s data. Second, my Markovian second-order analysis anticipates a jumping of the train, which would effectively refine Black-Scholes’ lognormal symmetry.
In other words, I’m not contradicting Black-Scholes because my probability density target is inside one standard deviation from spot. The only difference is refinement, narrowing the list of possibilities into probabilities.
Given that there could be a post-earnings pop (if the results are positive), I would consider the 21.00/21.50 bull call spread expiring Feb. 20. Here, you’re looking at a $25 wager to earn a profit of $25 or a payout of 100%.
On the date of publication, Josh Enomoto did not have (either directly or indirectly) positions in any of the securities mentioned in this article. All information and data in this article is solely for informational purposes. For more information please view the Barchart Disclosure Policy here.
/Micron%20Technology%20Inc_%20logo%20on%20building-by%20vzphotos%20vis%20iStock.jpg)
/AI%20(artificial%20intelligence)/AI%20engineer%20working%20on%20laptop%20by%20ART%20STOCK%20CREATIVE%20via%20Shutterstock.jpg)


/AI%20(artificial%20intelligence)/AI%20data%20center%20infrastructure%20by%20FOTOGRIN%20via%20Shutterstock.jpg)