
Exxon Mobil (XOM) is facing one of the more intriguing, high-stakes financial disclosures in its recent history. On a year-to-date basis, XOM stock has gained over 14%, a cynical beneficiary of geopolitical rumblings. With conflict brewing from Iranian-backed militias in the Middle East, the Trump administration — which is facing serious domestic pressure — has its hands full.
Adding to the firestorm, protests sparked by the fall of the Iranian currency in late December has spread across the country. Iran’s theocracy has responded with a violent crackdown, which has threatened regional stability. Amid the carnage, several oil stocks have seen their market value soar this month.
For Exxon Mobil, the situation is even more tense because it’s also scheduled to disclose its financial results on Friday before the opening bell. Wall Street analysts are looking for fourth-quarter earnings per share to hit $1.68 on revenue of $82.28 billion. In the year-ago quarter, the oil giant posted EPS of $1.67 on revenue of $83.43 billion. This print beat the EPS target of $1.55 but missed the sales estimate of $87.2 billion.
Generally, circumstances aren’t looking particularly hot for XOM stock. Although Exxon’s last two quarterly reports have delivered the goods on both the top and bottom lines, such beats have been increasingly rare.
Now, it’s true that over the trailing five years, XOM stock has gained nearly 207%. Nevertheless, if we take away some of the capricious benefits of timing, the bigger picture doesn’t look so impressive. For example, since 2022 — and discounting this month’s rally — XOM has largely trended sideways.
Even more significantly, the pensiveness isn’t just a narrative interpretation; rather, it has had a serious impact on how options traders have structured risk in Exxon Mobil stock.
Volatility Skew Really Tells the Tale of XOM Stock
Irrespective of your goals in the market, it’s always useful to consider the volatility skew of your favorite optionable securities. Volatility skew is a screener that identifies implied volatility (IV) or a stock’s potential kinetic output across the strike prices of a given options chain.
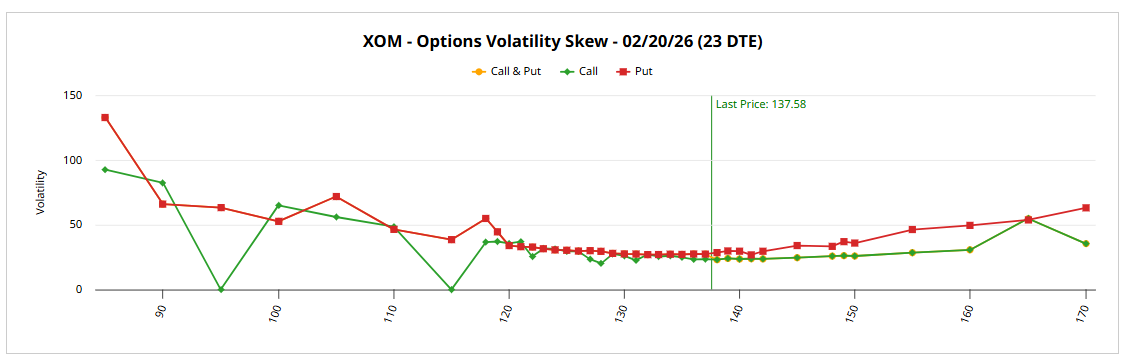
Looking at the Feb. 20 expiration date, the skew for XOM stock reveals elevated put option IV for the lower boundaries of the strike price spectrum. In addition, put IV is also elevated (relative to calls) in the upper boundaries. This setup leaves us with two clear takeaways.
First, the far out-the-money (OTM) put IV swing suggests that smart money traders are prioritizing volatility insurance. If XOM stock tumbles badly following the Q4 earnings report — which wouldn’t be an unusual development considering the aberrant January rally — many protective puts that are placed below the spot price may become profitable.
Second, on the other end of the scale, the elevated IV for puts in the upper bounds implies the presence of mechanical short positions, potentially to protect actual long exposure to XOM stock. It should be noted here that the smart money isn’t outright bearish on XOM; otherwise, you’d see a wave of sell orders. However, I think it’s clear that the sophisticated market participants are hedging their recent gains.
Adding to the pensiveness is Barchart’s options flow screener, which focuses exclusively on big block transactions likely placed by institutional investors. Net trade sentiment fell to $681,700 below parity, with traders focused on selling call options. Again, this doesn’t indicate outright bearishness but in context, the transactions communicate a lack of directional conviction.
Moreover, when we consider the quantitative picture of XOM stock, the hesitation that the smart money is exhibiting becomes even more understandable.
Narrowing Down a Likely Target for Exxon Mobil Stock
According to the Black-Scholes-derived expected move calculator, the anticipated dispersion of XOM stock for the Feb. 20 options chain currently lands between $131.53 and $143.63. This represents a high-low spread of 4.4% relative to the current spot price.
Essentially, what the Black-Scholes model is saying is that if returns are lognormally distributed, we would expect most prices to fall within one standard deviation from the spot price while accounting for volatility and days to expiration. Without getting bogged down with the math, the model assumes that in 68% of cases, XOM stock would likely range between roughly $132 and $144 at the end of the aforementioned expiration date.
Generally speaking, the assumption is a very reasonable one. However, as debit-side traders, we’re still left in the dark as to where XOM stock is likely to touch ground. To find a range of probabilities, we can apply a second-order inductive analysis using the Markov property.
Under Markov, the future state of a system depends solely on the current state. In other words, forward probabilities should not be calculated independently but instead assessed under the context of the ecosystem. To use a simple sports analogy, a 20-yard field goal attempt is considered an easy three points. Add the context of snow, wind and playoff pressure and the odds may change quite dramatically.
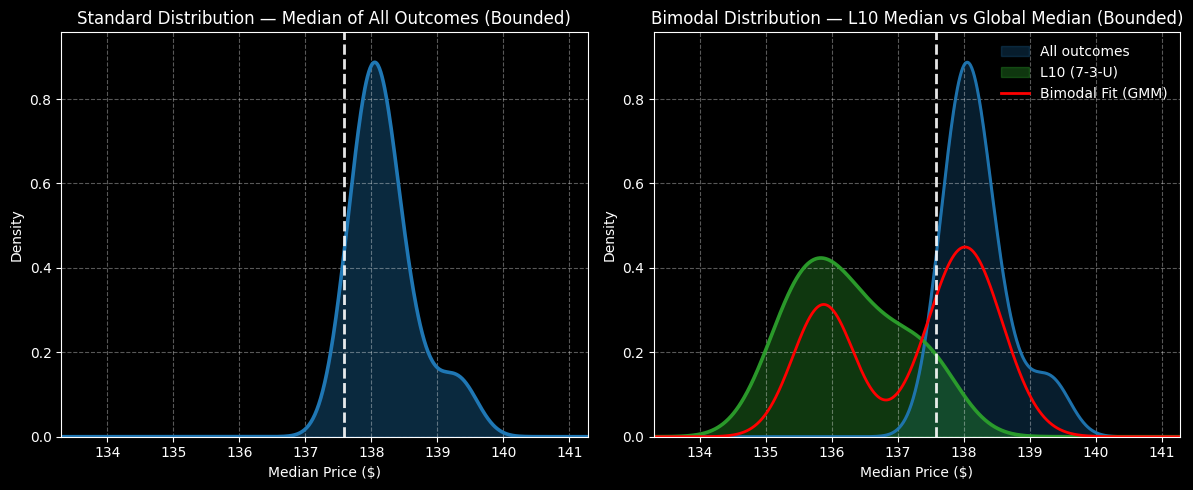
For Exxon Mobil stock, the current context is that the security printed seven up weeks in the last 10 weeks, leading to an overall upward slope. Typically, 10-week forward outcomes would be expected to range between $136.80 and $140 (using a dataset from January 2019 onward). However, under 7-3-U conditions, returns would be expected to range between $134 and $139.
Over the next one to five weeks, XOM stock would likely range between $133 and $139, with probability density peaking somewhere between $135 and $136. In other words, a security with an upward bias would probably shift negatively under 7-3-U conditions.
Playing the Numbers Game
If we were looking at XOM stock strictly from a quantitative perspective, the overall framework does seem pointed in the negative direction. Given the market intelligence above, aggressive speculators may consider the 137/135 bear put spread expiring Feb. 20.
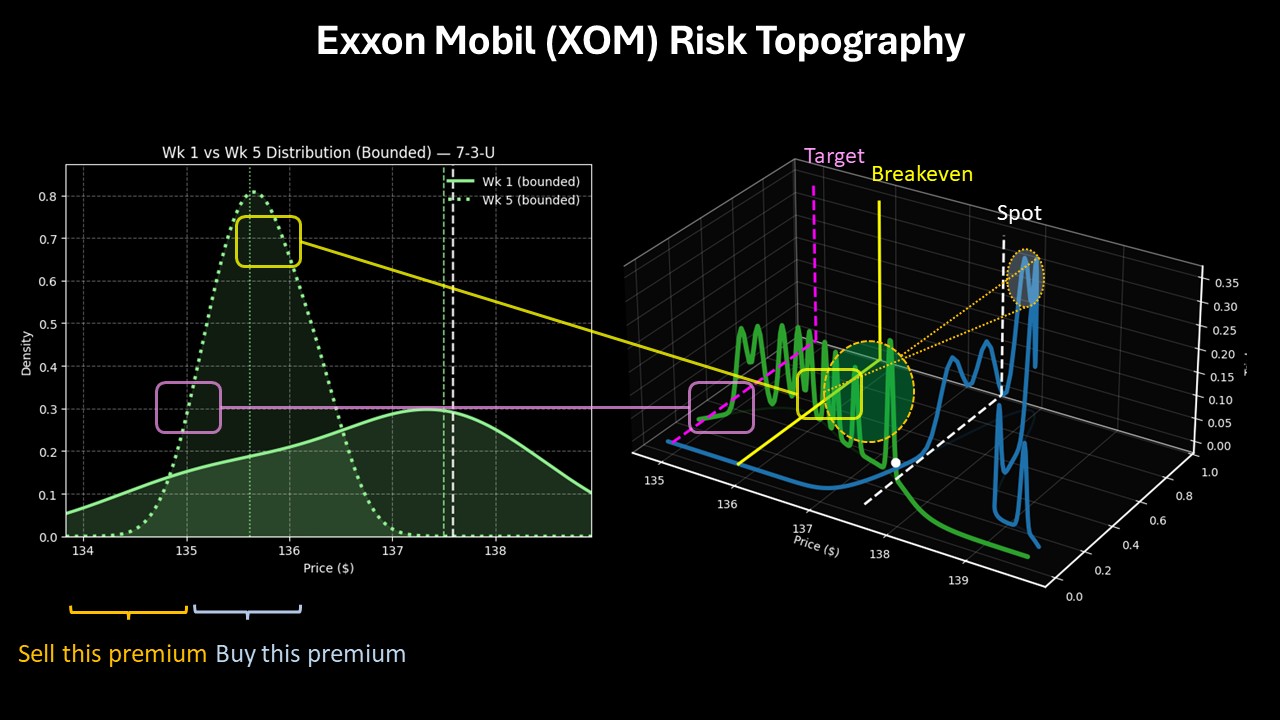
For this transaction to be fully profitable, XOM stock would need to fall through the second-leg strike ($135) at expiration. If it does, the maximum payout would come out to 83.49%. Breakeven lands at $135.91, which is very close to peak probability density under 7-3-U conditions.
To be clear, I’m not suggesting that Exxon Mobil stock will fall indefinitely. However, given the tendencies of its current quantitative structure, combined with the pensiveness in volatility skew, the bearish position might be the most prudent in the near term.
On the date of publication, Josh Enomoto did not have (either directly or indirectly) positions in any of the securities mentioned in this article. All information and data in this article is solely for informational purposes. For more information please view the Barchart Disclosure Policy here.


/United%20Parcel%20Service%2C%20Inc_%20logo%20on%20truck-by%20100pk%20via%20iStock.jpg)

/Netflix%20open%20on%20tablet%20by%20rswebsols%20via%20Pixabay.jpg)