
SoFi Technologies (SOFI) may well be one of the more perplexing ideas in the market right now. Mainly, the concern is that the obvious signs for SOFI stock don’t point in a positive direction. For example, Barchart’s Technical Opinion indicator rates SOFI as an 8% Weak Sell — and that’s justified by the security’s soft performance of 1.26% below parity for the new year.
Yes, in the past 52 weeks, SOFI stock has gained nearly 61%, which must be taken into account. However, the problem is that, since mid-September, the financial technology powerhouse hasn’t moved the needle, having been stuck within a sideways consolidation pattern. Now, given the non-ergodic nature of the stock market, the choppiness within the consolidation range has generated profits but that doesn’t really help ameliorate the wider narrative.
Ahead of the fourth-quarter earnings report to be released on Jan. 30, investors are looking for a clearer direction of forward viability. Part of the problem is the company’s runaway success, at least on paper. Going back to August 2021, SoFi has yet to outright miss against either earnings or growth targets; at worst, either the top or bottom line has landed at the consensus.
Of course, anything can happen. However, if we’re going with a statistically inductive framework, it would take a brave soul to say that SoFi is about to lose its track record in Q4. What’s more, certain developments in the options market suggests that controlled optimism is brewing among smart money traders.
First, in the unusual options screener on Friday, the structure of transactions suggests controlled optimism. On the put side, the modest-delta $21 cluster implies either systematic downside protection or structured positioning. This doesn’t read as panic but rather as a tactical method to protect against unexpected volatility. On the call side, traders have placed transactions across a wide spectrum of prices, suggesting a laddered upside exposure.
Second, options flow — which focuses exclusively on big block transactions — may be the biggest tell. While there have been plenty of big trades this month, overall, the broader direction is bullish. Most notably, on Jan. 12, net trade sentiment stood at nearly $5 million above parity, indicating bullish enthusiasm for SOFI stock.
Drilling into a Second-Order Analysis for SOFI Stock
Looking at the Expected Move calculator, the implied volatility (IV) of various options chains suggests anticipation of heightened activity. Since IV is a residual value stemming from actual order flows, it’s a powerful indicator as to how much kinetic potential a security may have for a given time period.
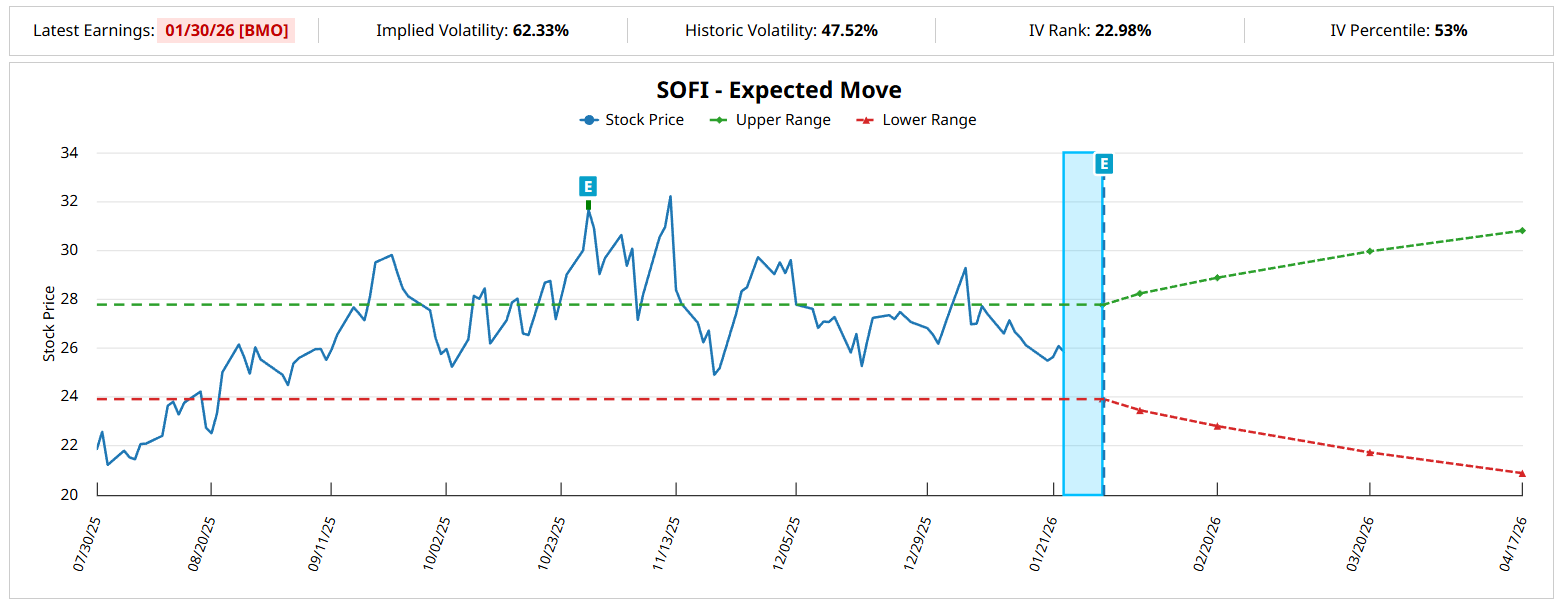
For the Feb. 20 expiration date, the Black-Scholes-derived Expected Move calculator is targeting a dispersion between $22.82 and $28.88, representing an 11.71% high-low spread relative to the current spot price (Friday’s close of $25.85). While this projected range is instructive, it’s also difficult for debit-side traders to cover every major gap in the spectrum.
In other words, the spread between the two aforementioned prices stands at roughly 27%. Theoretically, you could buy a long iron condor to play this trade. However, buying two premiums to address a bullish and bearish target can be quite expensive. If there was a way to determine which side is more likely to materialize, you would be incentivized to consider this approach.
One way to narrow the above dispersion is through a second-order analysis using the Markov property. Under Markov, the future state of a system depends solely on the current state. In effect, forward probabilities shouldn’t be independently calculated but instead analyzed through structural context.
A very simple sports example comes from football. A 20-yard field goal attempt is practically an easy three points in most circumstances. Add snow, wind and playoff pressure and that assumption may change quite dramatically. Again, it’s not a matter of simply calculating probabilities but calculating them in their proper context.
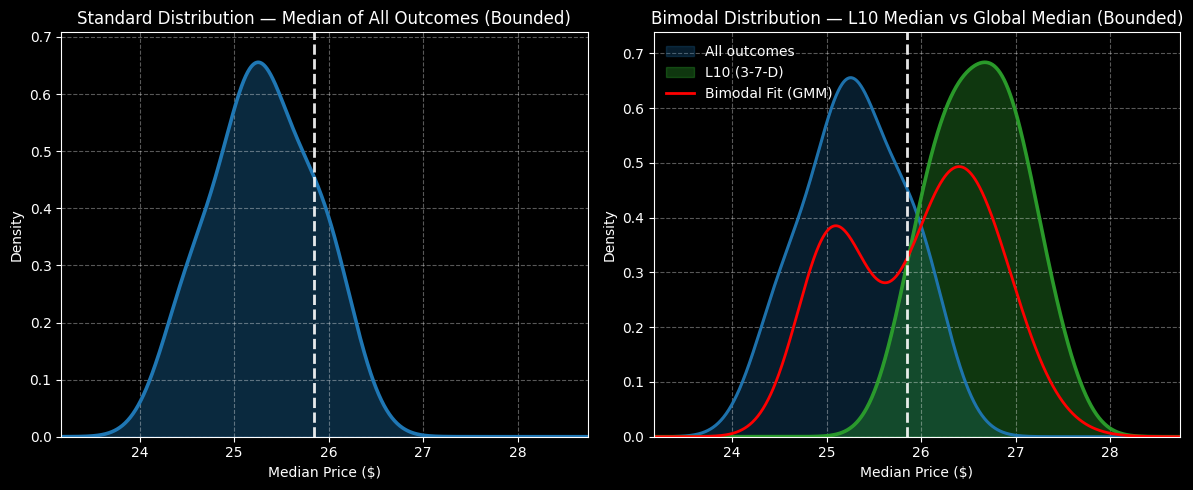
And what exactly is the context of SOFI stock? Heading into the weekend, SOFI had printed only three up weeks over the last 10 weeks, leading to an overall downward slope. Now, under aggregate conditions since its initial public offering, SOFI features a negative bias. A random 10-week long position would be expected to land between $23 and $27 (again, assuming a spot price of $25.85).
By contrast, under 3-7-D conditions, SOFI stock would be expected to range between $25 and $28 over the next 10 weeks. Past analogs also suggest that probability density would most likely peak between $26.30 and $27. In addition, over the next five weeks, peak density would likely not be materially different compared to the 10-week outlook, allowing us to push in our speculative timeframe.
Running the Numbers on SoFi Technologies
Based on the market intelligence above, I find the 26.50/27.00 bull call spread expiring Feb. 20 to be the most tempting proposition. This wager involves two simultaneous transactions: buy the $26.50 call and sell the $27 call, for a net debit paid of $23 (the most that can be lost).
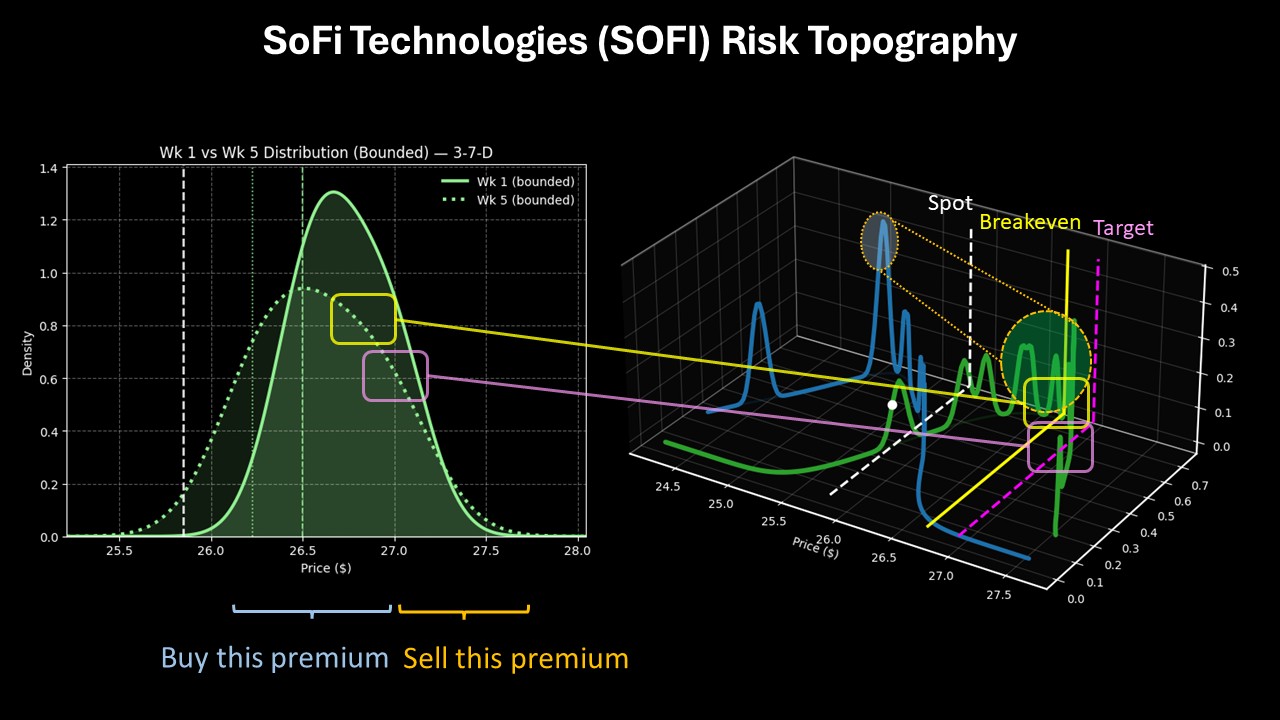
Should SOFI stock rise through the second-leg strike ($27) at expiration, the maximum profit would be $27, a payout of over 117%. Breakeven lands at $26.73, thereby adding to the trade’s probabilistic credibility.
Much of what makes this trade compelling is the inductive reasoning behind it. Through multiple trials of the 3-7-D sequence, past analogs would suggest that $27 is an aggressive but reasonable target. Further, the generally optimistic framing within the options market adds confidence to the bullish narrative.
On the date of publication, Josh Enomoto did not have (either directly or indirectly) positions in any of the securities mentioned in this article. All information and data in this article is solely for informational purposes. For more information please view the Barchart Disclosure Policy here.

/A%20close-up%20of%20a%20SpaceX%20sign%20by%20Sundry%20Photography%20via%20Adobe%20Stock.jpeg)
/Green%20hydrogen%20by%20Scharfsinn%20via%20Shutterstock.jpg)
/Abbvie%20Inc%20HQ%20photo-by%20vzphotos%20via%20iStock.jpg)
