
Chart of the Day
The information and opinions expressed below are based on my analysis of price behavior and chart activity
Sign Up to receive Walsh Trading’s 1st Half of 2026 Market Outlook First Half of 2026 Outlook for the Livestock and Grain markets.
Thursday, January 8, 2026
Is the recent downtrend in Soybeans over or just pausing?
If you like this article and would like to receive more information on the commodity markets from Walsh Trading, please use the link to join our daily email list -Click here
March Soybeans (Daily)
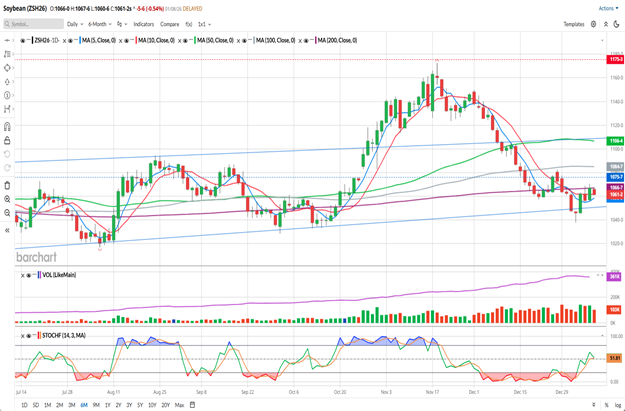
March Soybeans closed at 10.61 ¼ today, dropping 5 ¾ cents from Wednesday. Prices have rallied a bit this week, but have been unable to close back up above the 200-day moving average (purple, 10.66 7/8) after barely settling above it yesterday. Today’s trade was entirely within yesterday’s range, breaking the pattern of higher highs and higher lows that we saw for the first 3 days of the week. The settlement was a half of a tick below the 10-day average (red, 10.61 3/8) and can be viewed as holding support. The 5-day average (blue, 10.58 3/8) has turned back higher and should also be offering a support level. The 100-day average (grey, 10.84 7/8) and the 50-day average (green, 11.06 ½) are still in a bullish configuration, but are above the market and offering potential resistance levels. You may notice that the 50-day is also very near the blue trendline on the chart. (more on that later) Stochastics (bottom sub-graph) are about mid-range, recovering from an oversold condition that lasted for most of December. The spike low from last Friday did break the blue trendline support, but did not break the October lows and prices have subsequently bounced a little higher. When I see bars that look like last Friday (new low for the move but closing at/near the high of the bar) I would usually expect a decent rally to follow. We’ve seen some of that, but there may be more to come.
We’re finally getting current information regarding Export Sales and Commitment of Trader data, following the US Government shutdown, so market participants can stop guessing about where we’re actually at. I think that today’s weakness was, in part, due to this morning’s Export Sales being lackluster. In my opinion, it was data from the New Year’s week, when many facilities were short-staffed or closed, so it wouldn’t have been huge anyway. Soybean sales have been weak this year, as China wasn’t buying US Soybeans until relatively recently. By most accounts, they’re allegedly supposed to buy 12 million metric tons from us, and their recent purchases put them somewhere in the 10.5-11.00 mmt range. The are fulfilling their commitments, but most market participants may have been unaware of that, as the Export Sales data was delayed and the data we were getting was incomplete. The strangely ironic thing in my mind is that a rally won’t begin in earnest until their purchases are complete. Doesn’t make any logical sense, but sometimes logic gets tossed out the window when the markets are trading.
Monday, January 12th, the USDA will release Crop Production, Quarterly Grain Stocks and Monthly Supply/Demand reports. Typically (not always) this upcoming report sparks a seasonal rally in Beans. I think the big mystery heading into the reports is whether the USDA has factored in the Chinese purchases and how that affect the ending stocks number. They may adjust the average yield a little, but unless they remove significant acres I don’t believe the crop size will be changed much from the last USDA print of 4.253 billion bushels. I would expect Brazilian production to be increased a little from the USDA’s last estimate of 175.00 million metric tons and well above last year’s production of 171.5 mmt. We’ll find out Monday at 11 AM CT how the data comes out.
The way the daily chart looks to me, it seems to be a good time to take off short positions if you have them. If the report re-ignites the bears, you might miss some of a move lower but can always get back in.
Very aggressive and well-margined traders may do well to consider establishing long positions near the 5-day average at 10.58. A 10 cent sell stop would be at 10.48, below the lows of the past 3 sessions and very close to Monday’s low, would work out to a $500 loss, before your commissions/fees if that were triggered. Trendline support (blue line) is very near 10.50, as well. That might be a little close for a high volatility report day, but I feel you should always manage potential losses. For an upside target, I would suggest placing a GTC order at 10.98, which would result in a 40 cent profit, or $2,000 per contract, before commissions/fees. That might seem bit far away and unrealistic, seeing as how we haven’t traded there since December 12th, but sometimes the markets do wild things on report days.
Producers that still have Beans in the bin should consider Put Options to protect your downside risk. Even though I expect a bullish reaction, YOUR risk is still to lower prices. March Put Options expire in 43 days. There are also February Put Options that expire in 15 days if you prefer a shorter time frame and less cost out-of-pocket. Both are based off of the same futures contract. For example, the 10.50 March Puts closed at 15 7/8 cents today, or $793.75 per option, before commissions/fees. The February 10.50 Puts settled at 8 ¾ cents, or $437.50 before commissions/fees. The difference in price represents the extra time value for the March options. The delta on both of those strike prices is near .30, so you’ll need 3 or more options to adequately cover each 5,000 bushels you want to protect. For report day, I would suggest placing GTC orders at 3x what you paid for the options, in case the market makes a wild move lower. If the report is bullish, I would suggest exiting the options immediately whenever YOU are convinced the market is going back up. If that’s at 11:05 AM on Monday or at noon next Friday, so be it.
March Soybeans (Weekly)
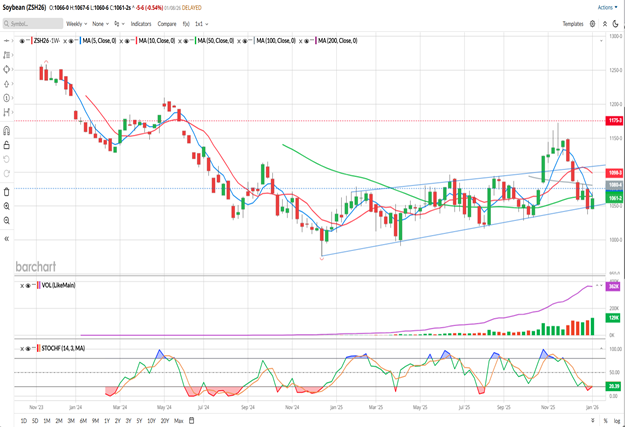
The weekly view shows me that we’ve been in a choppy, but uptrending market since the middle of December 2024. You might notice the blue trendline that I’ve drawn from that low to the low in late-October of 2025. I see a market that has been posting waves of higher highs and higher lows since then. The breakout above the upper blue trendline that began with a large gap up the last week of October did run out of steam, but the market has failed to fill the gap left in May of 2024, denoted by the red horizontal dotted line. I think that gap is still in play, but time will tell if I’m correct about that. Prices are currently below all of the weekly moving averages with the 50- and 10-week averages being the closest resistance at 10.64 ½ (green) and 10.65 1/8 (blue) respectively. The 50-week was broken last week, but I’m willing to discount that because of holiday trade. The -50-week also has a slight inclination to it, at the moment. Stochastics are barely out of the oversold condition. For the past year, it appears to my eye that the market has been more willing to be overbought than oversold. In my opinion, the channel support should hold and prices should bounce higher following the USDA reports.
You can view Barchart’s seasonal data here. Soybeans tend to rally the first 4 months of the year, over the past 15 years. Not every month and not every year, but the average performance to start the year is generally bullish.
Sign Up to receive Walsh Trading’s 1st Half of 2026 Market Outlook First Half of 2026 Outlook for the Livestock and Grain markets.
If you like what you’ve read here and would like to see more like this from Walsh Trading, please Click here and sign up for our daily futures market email.
Jefferson Fosse Walsh Trading
Direct 312 957 8248 Toll Free 800 556 9411
jfosse@walshtrading.com www.walshtrading.com
Walsh Trading, Inc. is registered as a Guaranteed Introducing Broker with the Commodity Futures Trading Commission and an NFA Member.
Futures and options trading involves substantial risk and is not suitable for all investors. Therefore, individuals should carefully consider their financial condition in deciding whether to trade. Option traders should be aware that the exercise of a long option will result in a futures position. The valuation of futures and options may fluctuate, and as a result, clients may lose more than their original investment. The information contained on this site is the opinion of the writer or was obtained from sources cited within the commentary. The impact on market prices due to seasonal or market cycles and current news events may already be reflected in market prices. PAST PERFORMANCE IS NOT NECESSARILY INDICATIVE OF FUTURE RESULTS. All information, communications, publications, and reports, including this specific material, used and distributed by Walsh Trading, Inc. (“WTI”) shall be construed as a solicitation for entering into a derivatives transaction. WTI does not distribute research reports, employ research analysts, or maintain a research department as defined in CFTC Regulation 1.71.


/Technology%20abstract%20by%20TU%20IS%20via%20iStock.jpg)
