Chart of the Day
The information and opinions expressed below are based on my analysis of price behavior and chart activity
Thursday, December 18, 2025
Can Corn catch a rally as we head into holiday trade?
If you like this article and would like to receive more information on the commodity markets from Walsh Trading, please use the link to join our email list -Click here
March Corn (Daily)
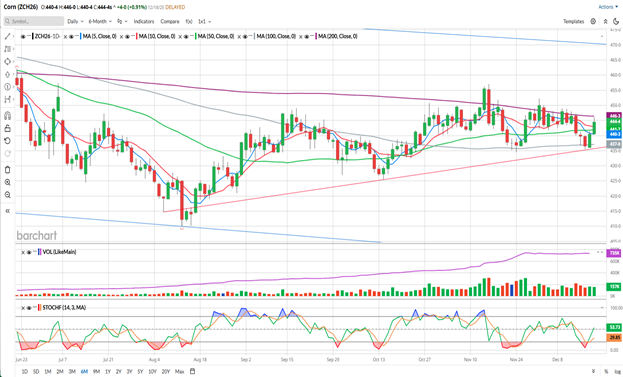
Today, March Corn closed at 444 ½, up 4 cents on the day. Trendline support, drawn off of the August 6th and October 14th lows, has held so far this week. That’s indicated by the red trendline on the chart above. Prices are also above all of the moving averages on my chart, with the exception of the 200-day average (purple) which is still offering nearby resistance at 446 3/8. The 100-day (grey, 437) was tested for the first three days of the week, and has held. Today’s close was also above the 50-day (green, 441 7/8) and the 5- and 10-day moving averages. The 5- and 10- (blue and red, 440 3/8 and 442 7/8, respectively) are still in a bearish configuration, as they made a bearish crossover on December 10th. I would think that those averages should offer near-term support, as we move forward. Stochastics (bottom sub-graph) have recovered from a brief (1 day) oversold condition and are currently pointing toward further strength.
Overall, this market appears to be working itself into a corner, so to speak. The trendline support is rising and the 200-day average is still declining. Wednesday’s trade saw a bullish engulfment on the chart, opening below Tuesday’s close and then closing above Tuesday’s high. Usually, a chart pattern like that is a strong indicator. This week’s low of 435 ½ did not set a new low, relative to the 434 ½ low set just before Thanksgiving, but the December 2nd high of 452 ¼ did not set a new high relative to the November 14th high. Basically, Corn prices have been sideways since the end of October. I think we’re getting close to a breakout, one way or another. I lean heavily toward a bullish breakout higher. Seasonal patterns influence that opinion, but recent demand as measured by the Export Inspections and Ethanol Production reports has been bullish. Export Inspections (actual grain getting inspected for loadout on a ship or rail) are nearly double where we were a year ago, indicating strong export demand to me. Ethanol production also remains at elevated levels, although the next 2 weeks of holiday trade will likely see that trimmed a bit. The 5-year seasonal patterns suggest an aggressive move toward 500 or higher over the next two month, while the 15- and 30-year patterns suggest a milder rally toward 460. If you’d like to see that chart, contact me and I can send that to you directly.
I am bullish Corn, but I currently don’t see a solid entry for the futures at this time. For the aggressive and well-margined traders that want to take a shot at the long side, I would think your risk would be just under this week’s low of 435 ½ or perhaps the low of November 24th, 434 ½. If the market fails to clear the 200-day resistance and heads back lower, that would be a bearish event, in my opinion.
Less aggressive traders may do well to consider bullish Call option positions. March options expire in 64 days. 450 March Calls closed at 9 cents today, or $450 before your commissions/fees. March 460 Calls closed at 5 ¾ cents today, or $287.50 before your commissions/fees. I don’t think I’d go out much higher in strike prices than those, as there is trendline resistance near the 470 mark, if you can see the blue trendline in the chart above. There’s a better view on the weekly chart below. If you’re replacing bushels that you’ve sold, remember to check the option delta and scale your position to match the bushels you’ve sold. Regardless of which option you choose, set a GTC profit target at 2x what you paid for the option. I’m not sure I’d recommend a GTC Sell Stop, but rather set an alert at ½ of what you paid for the options and either get out then, or reevaluate the market.
March Corn (Weekly)
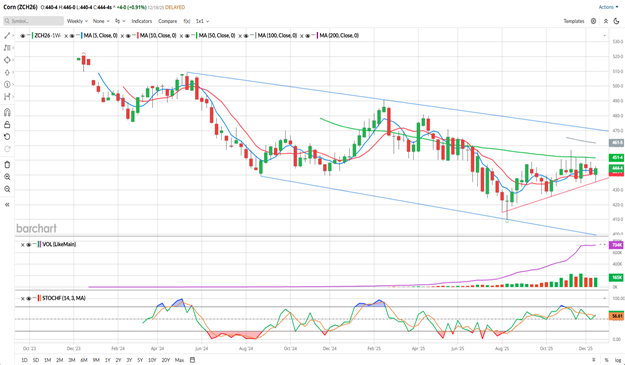
For the week so far, March Corn is up 3 ¾ cents. Not a huge gain, but still a positive move. The weekly view shows a market that has been in a downward trending channel for the life of the contract, as shown by the blue trendlines. However, the market is currently trading slightly above middle of that range. You might see that red trendline, connecting the August and October lows, is inclined higher and has offered support earlier this week. The 50-week (green, 451 ½) and the 100-week (grey, 461 5/8) are both above the market price and appear to be declining. The 50-week average does look like it’s slowing the decline, to me anyway, and prices are basically where they were in September. The 5- and 10-week moving averages (blue and red, 443 and 441 7/8, respectively) made a bullish crossover a little over a month ago, but there’s not been any strong directional trend. The Corn market seems to have been content for the past 8 weeks trading in a range. Looking back over the chart, you may notice that the last significant rally in this contract began in December of last year and ended with February high of 490 ¾. Could a similar rally occur now? I do think it’s quite possible, but I wouldn’t expect a move to 490, but rather to that overhead blue trendline, near 470. It’s also interesting to note, I think, that the rally last year started from roughly the same price level we’re currently at. Perhaps it can get to 490. The 50-week average has been strong resistance to an extended rally in Corn. It’s been tested a few times, but we haven’t seen a weekly close above that average since the first week of June. Weekly Stochastics (bottom sub-graph) are turning up from the 50% level, like it has since making the contract low in August.
I also think the recent 1.00+ selloff in the Soybean market has capped some of the potential bullishness. It seems to me that it’s always been difficult for Corn to rally when related markets are trending in an opposite direction. If Soybeans can catch a rally, or at least stop going down, that should make it easier for the Corn bulls. We’re still behind on current Export Sales and Commitment of Trader data, but the USDA expects to be caught up in the first full week of January, as they work through the government shutdown backlog. Today’s Export Sales report was as of November 27th, so it seems that they’ll hit their target there. Weekly Stochastics (bottom sub-graph) are turning up from the 50% level, like it has since making the contract low.
If you like what you’ve read here and would like to see more like this from Walsh Trading, please Click here and sign up for our daily futures market email.
Jefferson Fosse Walsh Trading
Direct 312 957 8248 Toll Free 800 556 9411
jfosse@walshtrading.com www.walshtrading.com
Walsh Trading, Inc. is registered as a Guaranteed Introducing Broker with the Commodity Futures Trading Commission and an NFA Member.
Futures and options trading involves substantial risk and is not suitable for all investors. Therefore, individuals should carefully consider their financial condition in deciding whether to trade. Option traders should be aware that the exercise of a long option will result in a futures position. The valuation of futures and options may fluctuate, and as a result, clients may lose more than their original investment. The information contained on this site is the opinion of the writer or was obtained from sources cited within the commentary. The impact on market prices due to seasonal or market cycles and current news events may already be reflected in market prices. PAST PERFORMANCE IS NOT NECESSARILY INDICATIVE OF FUTURE RESULTS. All information, communications, publications, and reports, including this specific material, used and distributed by Walsh Trading, Inc. (“WTI”) shall be construed as a solicitation for entering into a derivatives transaction. WTI does not distribute research reports, employ research analysts, or maintain a research department as defined in CFTC Regulation 1.71.


/AI%20(artificial%20intelligence)/3D%20Graphics%20Concept%20Big%20Data%20Center%20by%20Gorodenkoff%20via%20Shutterstock.jpg)