/Micron%20Technology%20Inc_billboard-by%20Poetra_RH%20via%20Shutterstock.jpg)
Micron Technology (MU) wasn’t the top mover yesterday in Barchart’s Top 100 Stocks to Buy. That award goes to Outlook Therapeutics (OTLK), which jumped into the 25th spot, from off the chart previously.
However, Micron moved up 14 spots in Monday’s trading to 36th place. More importantly, the maker of high-performance DRAM (Dynamic Random Access Memory) and other memory and storage products recorded a price volume of 6.53 million, nearly four times that of the top 100 runner-up, IREN (IREN).
I’m not a huge tech person, but if you’re in the top 100, and you can generate this kind of price volume, investor interest is definitely there, which will always get my attention.
Micron’s stock is up 131.71% in the past 12 months, but its weighted alpha is 218.09, suggesting recent momentum in its share price; it’s up 18% since Nov. 20.
Is Micron’s price-volume a buy signal for those who’ve yet to buy the Boise-based tech company’s stock? Maybe. Here’s why.
What Is Price Volume and Why Does It Matter?
Price volume is a stock’s current price multiplied by its current volume divided by 1,000. In Micron’s case, its share price closed Monday trading at $237.50 with volume of 27,483,600. That’s a price volume of 6.53 million, nearly four times IREN’s, the second-highest price volume of the top 100.
So, why does price volume matter?
Investors use it to assess how committed buyers are to a particular stock. A very bullish indicator is a rising share price combined with rising volume. Yesterday’s Micron volume was 1.18 times its 20-day average of 23.35 million. However, MU stock lost 1.5% yesterday.
In a vacuum, that’s a bearish signal, but as I said in the introduction, its stock is up 18% since Nov. 20, a bullish signal, hence the weighted alpha over 218. One day does not make a confirmation unless you’re a day trader.
For example, between Nov. 17 and Nov. 20, MU stock fell for four consecutive sessions: -1.98%, -5.56%, -1.13%, and -10.87%, with average daily volume of 36.71 million, well above its 20-day average. That’s most certainly bearish.
The stock then reverses, delivering gains in 10 of the next 13 days, but on lighter-than-average volume. That’s a sign buyers are losing their enthusiasm. Notably, its shares have fallen for three consecutive days on above-average volume. That’s a sign the stock could continue to decline.
Meanwhile, the Barchart Technical Opinion is a Strong Buy, with short-term weakness anticipated, followed by long-term gains.
Early in Tuesday trading, volume is heavy at 839,939, and up slightly, suggesting the price volume will be heavy again today.
From an options perspective, yesterday's volume was less than the 30-day average of 197,816. However, two of the four days have been higher, so this indicator is sending mixed messages.
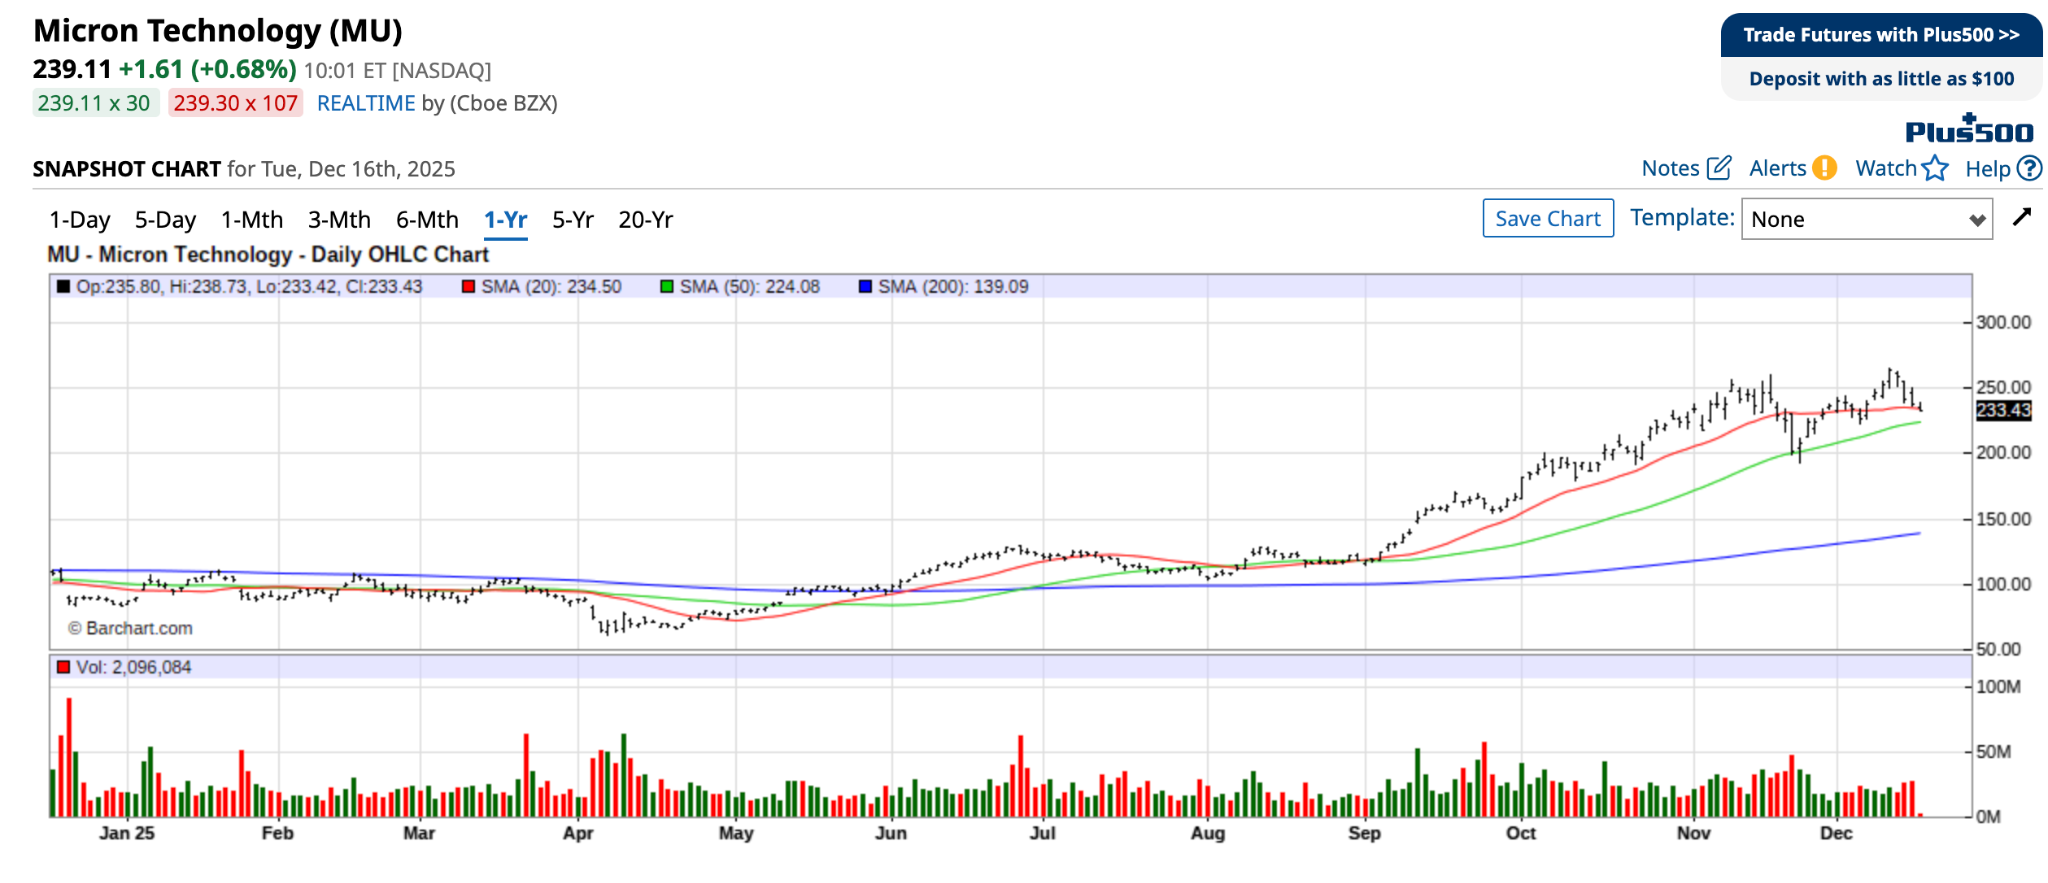
Source: Barchart.com
I’m not a technical analyst, but the chart above suggests the 20-day moving average (green line) is about to cross below the longer-term 50-day MA (red line), a bearish signal. Investors might want to wait to see how this trend plays out. Micron reports its Q1 2026 results tomorrow after the markets close.
A Valuation Perspective Could Help
Yardeni Research provides some of the best data and charts available. It believes the markets are overvalued.
The S&P 500 forward P/E as of Dec. 15, according to Yardeni, is 22.5, while the forward P/E for the S&P 500 technology sector is 28.2, or 25% more expensive than the index as a whole. The tech sector’s forward P/E hasn’t been this high since 2022 or 2004.
I’ve recently written about Howard Marks’ views on the index’s valuation—he thinks the Mag 7 are more expensive because they’re great companies that generate massive cash flow. Still, the valuations of the other 493 companies are the more worrisome aspect right now.
Yardeni himself thinks somewhat the opposite -- he recently told Barron’s, “In effect, we are recommending underweighting the Magnificent 7 and overweighting the ‘Impressive 493’ in an S&P 500 portfolio,” Barron’s contributor Martin Baccardax reported on Dec. 8.
Micron is one of those 493.
MarketWatch’s Philip Van Doorn and Christine Ji wrote about big tech stocks getting cheaper since the beginning of October. The authors screened for the 20 largest S&P 500 companies by market cap whose forward P/E valuations had declined since Sept. 30 and whose rolling 12-month EPS (earnings per share) estimates were increasing.
Micron is one of the 20. According to the data, Micron’s forward P/E at the end of September was 10.1. As of yesterday, it was 9.5. At the same time, its 12-month EPS estimate has increased by 27% since Sept. 30, to $20.89 a share.
Since Sept. 3o, Micron stock has gained nearly 42%, the best performance among the 20 stocks. Meanwhile, the company’s sales are expected to grow by 27% over the next 24 months, with an EPS CAGR (compound annual growth rate) of 45.2%.
What’s not to like?
The one thing that sits in the back of my mind is that Micron’s often had a low forward P/E in the past. The average forward P/E on Dec. 31, 2021, was 9.64; it was 4.74 and 4.24 on Dec. 31, 2018, and Dec. 31, 2017, respectively. In the past decade, except for 2020 and 2019, the forward P/E’s have always been around 12 or lower.
Investors have historically not treated Micron with the same respect as Nvidia (NVDA). That doesn’t mean you shouldn’t buy Micron after significant gains in 2025 -- its shares are up 177% year to date with two weeks left in the year.
Of the 40 analysts covering Micron stock, 37 rate it a Buy, with a median target price of $275, 18% above its current price.
I would not be in a rush to buy MU stock. Wait for tomorrow’s earnings to figure out where it’s headed in the near-term.
The price-volume suggests MU could be lower. However, in hindsight, $233 will be a good entry point for a long-term hold.
On the date of publication, Will Ashworth did not have (either directly or indirectly) positions in any of the securities mentioned in this article. All information and data in this article is solely for informational purposes. For more information please view the Barchart Disclosure Policy here.

/A%20close-up%20of%20a%20SpaceX%20sign%20by%20Sundry%20Photography%20via%20Adobe%20Stock.jpeg)

/AI%20(artificial%20intelligence)/AI%20chip%20by%203Dsss%20via%20Shutterstock.jpg)
