Chart of the Day
The information and opinions expressed below are based on my analysis of price behavior and chart activity
Tuesday, December 9, 2025
February Live Cattle – Is this a repeat of 2023?
If you like this article and would like to receive more information on the commodity markets from Walsh Trading, please use the link to join our email list -Click here
February 2026 Live Cattle (Daily)
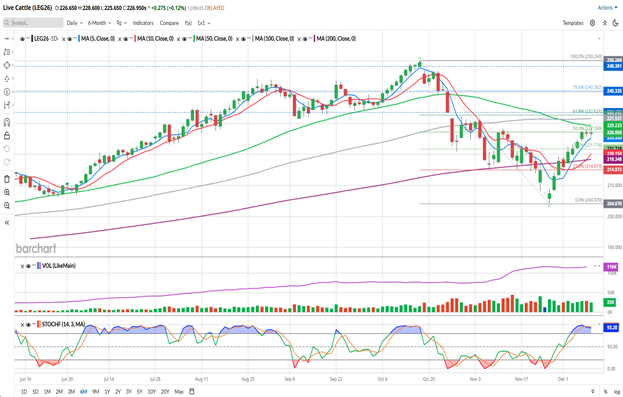
Today, February Live Cattle closed at 226.950, gaining 0.275 on the day. It’s only Tuesday, but for the week the puts the Feb contract down 0.200 from Friday’s close. You might notice a few things by looking at the chart above. First off, you might see the Fibonacci levels that I’ve placed on the chart, extending from the contract high on October 16th to the recent low on November 25th. Prices ran into the 50% retracement (227.150, approximately) last Friday and lost some of the bullish momentum. This week, we’ve seen prices keep inching up, with higher highs and higher lows both Monday and Tuesday, but there’s been a lack of a strong close, up or down, this week. The 50- and 100-day moving averages (green and grey, respectively) made a bearish crossover on December 1st, but the 5- and 10-day moving averages made a bullish crossover on December 2nd. Those are the blue and red averages, respectively. Prices broke through the 200-day moving average (purple) on November 20th but recovered to close back above that average on December 2nd. In my estimation, that puts the long term (200-day) trend back in bullish territory along with the short-term (5- and 10-day) trend, with the medium-term trend still on the bearish side. There are still 3 price gaps up above, with the closest being the October 24th low of 233.425. Those are denoted by the blue dotted horizontal lines that you might see up above. Stochastics (bottom sub-graph) are in overbought status. Looking back over the chart, it seems to me that this market has been more willing to stay overbought (blue) as opposed to oversold (red) over the life of this chart. Current price levels also correspond with a 3-day shelf of resistance from November 10th to the 12th. We saw prices break through that Nov. 11th high of 228.175 with today’s trade, but no strong close up above that mark yet.
Traders may find themselves a bit fundamentally conflicted these days. On one hand, the US Gov’t is making statements that they want lower beef prices. They’ve taken some action to accomplish that, by increasing Argentina’s beef import quotas and reducing the South American tariff rates. That may help a bit for retail demand and pricing, but does nothing to increase the supply of cattle here in the US. On the other hand, we’re seeing a domestic cattle herd hitting 70-year lows, as far as the number of animals. Additionally, the cattle that we might normally see as imports from Mexico are not here, as the border remains closed to livestock movement. And we have more people to feed with less US cattle and beef production. In my opinion, the fundamentals remain bullish. Until there is some significant retention of heifers in the nationwide herd or a dramatic outside economic event, I would expect that condition to remain.
I’m also of the opinion that we’ve seen this before. I think the phrase “history doesn’t repeat, but it rhymes” comes to mind.
The most recent sell-off from the contract high on October 16th at 250.175 to the November 25th low of 204.325 resulted in a decline of 45.850, or a decline of 18.3%. The chart below is the February 2024 contract.
February 2024 Live Cattle (Daily)
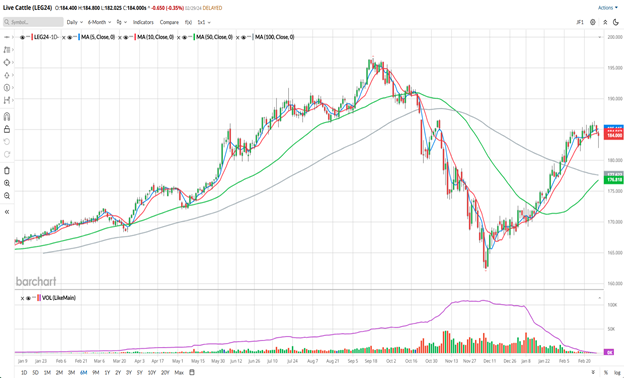
That Live Cattle contract posted a contract high on September 19th of 196.600 and dropped to 162.400 on December 7th. That worked out to a drop of 34.200 or a decline of 17.4%. A very similar result, on a percentage basis, to what we’ve seen recently in the Feb 26 contract. When viewed on a weekly continuous chart (below) you might notice that the grey shaded circle seems like a minor speedbump in a long-term uptrend. At least, that’s how it looks to me. But at the time, everything was bearish, cattle prices were done going up and would never recover, if I recall correctly. Time has proven that bearish sentiment to be false, as new highs were posted many times following that sell-off.
Live Cattle, weekly, continuous data
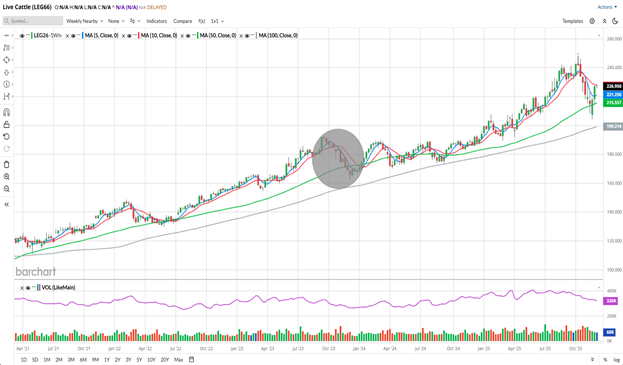
Overall, the weekly chart is STILL in an uptrend and I think that will continue. Until the market breaks through the 100-week average (grey, 199.214 today) I will maintain that bullish line of thought.
It’s not going to go straight up, but even today’s WASDE report from the USDA (here’s a link, you’ll need to look at page 31) indicates that the US Gov’t expects less beef production and higher prices through 3Q of 2026.
Aggressive and well-margined traders may do well to consider long futures positions, perhaps on a dip to the 5-day moving average (225.325-ish) or even the 38% Fibonacci level near 221.750. As I don’t know your risk tolerance or your funding levels, I’ll leave the entry and protective stop levels up to you. As far as an upside target, I would suggest the first gap on the chart at 233.425.
Less aggressive traders may do well to consider long Call Option positions. February options have 59 days until expiration. 230.000 Calls closed at 5.075 today, or $2,030 before your commissions/fees. I would suggest setting a GTC target at 3x what you paid for the call. I think your risk should be about ½ of the premium paid. I’m not sure I’d recommend a GTC Sell-Stop in Cattle options, but that’s a conversation between you and your broker. At today’s settlement prices, that would result in a gain of $5,075, per option, with a risk of about $1,268.75, before your commissions/fees.
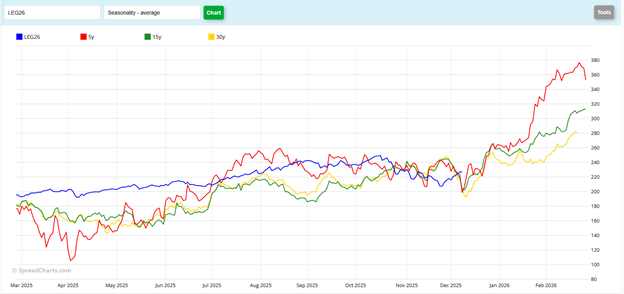
Readers on Barchart can see the seasonal data here. Their data show an average gain in December of 3.342, but according to a monthly chart, prices have already gained 9.100 in December, exceeding the average gain.
Readers on WalshTrading.com will be able to view the seasonal chart below. This chart projects to a price near 241.000 (30-year pattern), 279.000 (15-year pattern) and a very aggressive 340.000 (5-year pattern) by February 1st.
If you like what you’ve read here and would like to see more like this from Walsh Trading, please Click here and sign up for our daily futures market email.
Jefferson Fosse Walsh Trading
Direct 312 957 8248 Toll Free 800 556 9411
jfosse@walshtrading.com www.walshtrading.com
Walsh Trading, Inc. is registered as a Guaranteed Introducing Broker with the Commodity Futures Trading Commission and an NFA Member.
Futures and options trading involves substantial risk and is not suitable for all investors. Therefore, individuals should carefully consider their financial condition in deciding whether to trade. Option traders should be aware that the exercise of a long option will result in a futures position. The valuation of futures and options may fluctuate, and as a result, clients may lose more than their original investment. The information contained on this site is the opinion of the writer or was obtained from sources cited within the commentary. The impact on market prices due to seasonal or market cycles and current news events may already be reflected in market prices. PAST PERFORMANCE IS NOT NECESSARILY INDICATIVE OF FUTURE RESULTS. All information, communications, publications, and reports, including this specific material, used and distributed by Walsh Trading, Inc. (“WTI”) shall be construed as a solicitation for entering into a derivatives transaction. WTI does not distribute research reports, employ research analysts, or maintain a research department as defined in CFTC Regulation 1.71.
/Advanced%20Micro%20Devices%20Inc_%20office%20sign-by%20Poetra_RH%20via%20Shutterstock.jpg)
/Alphabet%20(Google)%20Image%20by%20Markus%20Mainka%20via%20Shutterstock.jpg)

/Tesla%20Inc%20logo%20by-%20baileystock%20via%20iStock.jpg)