The bulls are still in control...for now
By John D. Thorpe, Senior Broker
Financial news networks and pundits are repeating “Bubble” due to the recent sell off in equities, “AI Bubble” Google boss Pichai “AI investment boom has elements of irrationality., “No Firm immune!” Bob Michele, JPMorgan’s Chief Investment Officer , discusses lessons learned from the Dot.com bubble. Warning shots to be certain and perhaps the market is ripe for a change in tenor. Rather than a blow the doors off rally or a sideways market. ( you can make a case the S&P 500 index has been trading in a range since mid Sep.) where is the demarcation line that tells us we are in a Bear market? We are still in a Bull market so I thought I would do a deep dive into the technical indicator that has provided traders with meaningful support for a continuation of a Bull market. Or, once crossed, the resistance and the tenor of a Bear market.
The 200-day Simple Moving Average (200-day SMA) is one of the most widely watched technical indicators in global financial markets, especially for the S&P 500. Its importance comes from a combination of institutional usage, psychological reinforcement, and historical track record. Here’s why it matters so much:
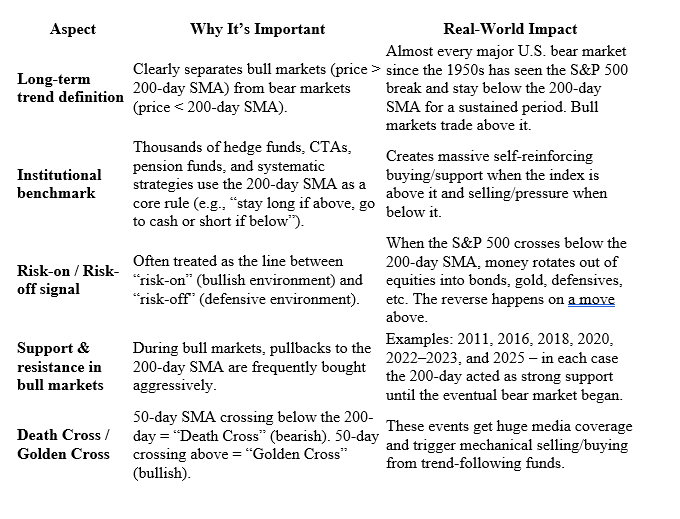
Quick Historical Examples
- March 2020: S&P crashed below 200-day → confirmed bear market → trillions in systematic selling.
- October 2022: Reclaimed the 200-day SMA → signaled new bull market → +45% rally since.
- 2025 so far: Multiple tests of the rising 200-day were bought aggressively, reinforcing its role as dynamic support.
Bottom Line
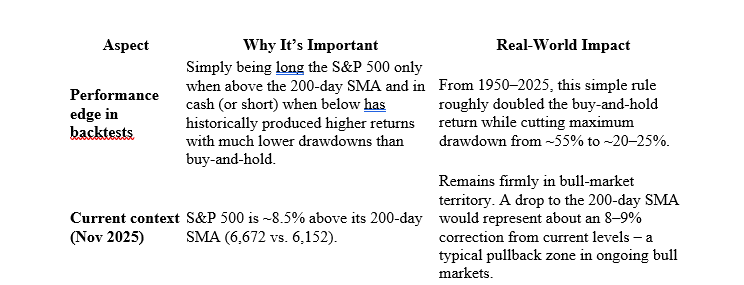
The 200-day SMA is not magic, but because so many large players watch it and trade it, it has become one of the most important price levels on the chart. For the S&P 500 right now (November 2025), staying above ≈6,150–6,200 keeps the long-term bull market intact. A sustained break below would be a major warning signal that the character of the market has changed.
Where is the 200 Day today?
As of November 18, 2025 (using the most recent market close on November 17, 2025, as markets are closed over the weekend), the 200-day simple moving average (SMA) for the S&P 500 index is 6,151.63. This value reflects a slight increase of +3.16 (+0.05%) from the prior day, driven by the index's ongoing bull market momentum.
For context:
- The S&P 500 closed at 6,672.41 on November 17, trading well above its 200-day SMA (a bullish signal, as the index is approximately 8.5% higher).
- The 200-day SMA is a widely used long-term trend indicator, calculated as the average closing price over the past 200 trading days.
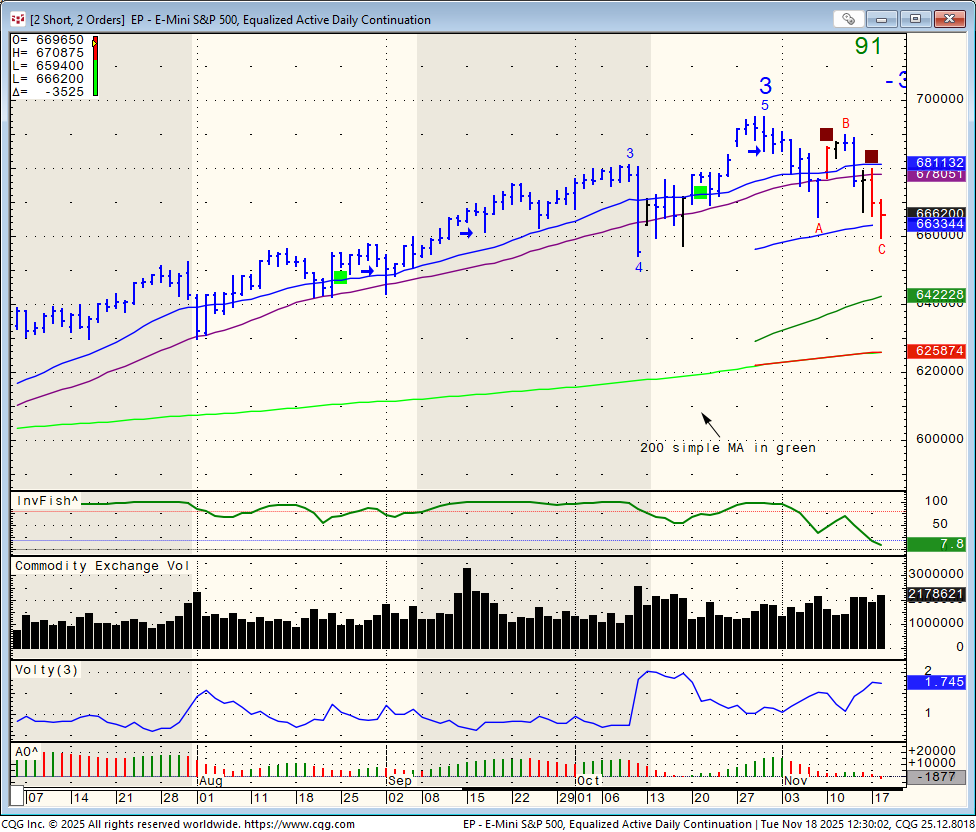
Mini SP daily chart with the 200 simple moving average below for review - pay attention to the recent sell signal we got on the daily chart in the form of a maroon square
Plan your trade, trade your plan!
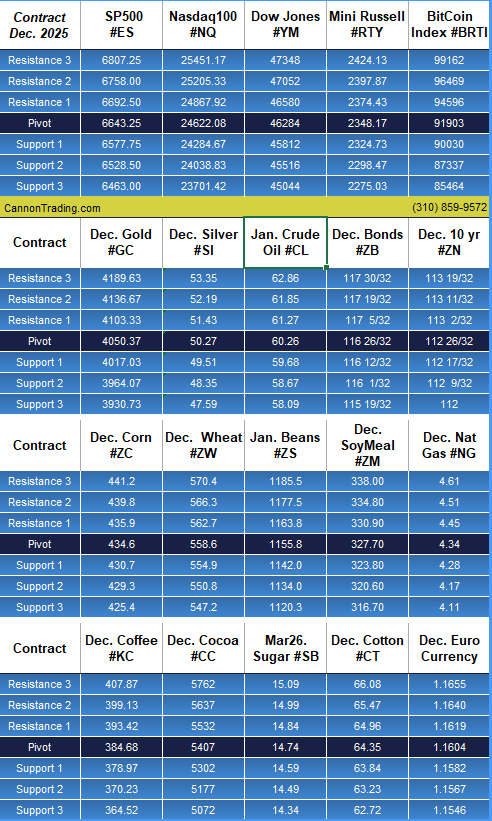
Here are the trading levels for major markets for tomorrow - FOMC minutes day.
Good Trading!
Cannon Trading Co, Inc. Est. 1988
www.CannonTrading.com
Toll Free: 800-454-9572
Int'l: +310-859-9572
Margins / Commissions / Platforms / Professional Traders /Free Demo
Trading commodity futures and options involves a substantial risk of loss.
The information here is of opinion only and do not guarantee any profits.
Past performances are not necessarily indicative of future results.


/AI%20(artificial%20intelligence)/An%20aerial%20view%20of%20a%20data%20center%20cooling%20system%20by%20Sepia100%20via%20Adobe%20Stock.jpeg)