Chart of the Day
The information and opinions expressed below are based on my analysis of price behavior and chart activity
Sign Up to receive Walsh Trading’s 1st Half of 2026 Market Outlook First Half of 2026 Outlook for the Livestock and Grain markets.
Tuesday, February 3, 2026
If you like this article and would like to receive more information on the commodity markets from Walsh Trading, please use the link to join our daily email list -Click here
April Live Cattle (Daily)
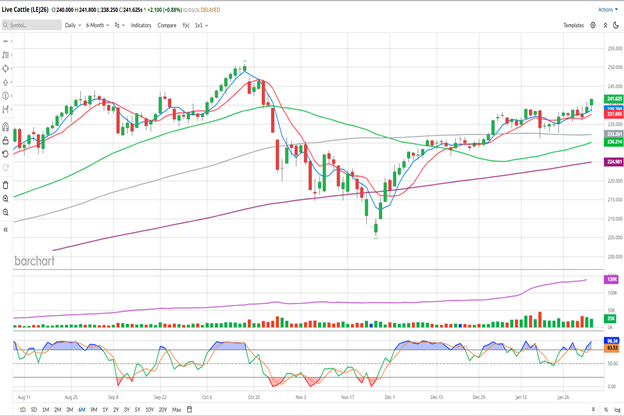
April Live Cattle closed at 241.625 on Tuesday, up 2.100 on the day. This marks the highest close since October 21st. By looking at the chart above, you may notice that today’s settlement is also a “break out” close higher than the January highs. There appears to have been some solid resistance near the 239.000 level that had persisted for the month, before Friday’s Cattle Inventory report allowed the bulls to push through in the first 2 trading days of February. The gist of the report was that US Cattle numbers are the lowest in about 75 years. You can view the report here, if you like. That makes 2 consecutive Friday afternoon reports that are bullish for Cattle, following the Cattle on Feed report from January 23rd. That Cattle on Feed report can be found here. Both of those datasets indicate the tightness of the cattle supplies and neither is showing any meaningful signs of heifer retention for herd rebuilding. As I’ve been saying to my clients for a while now, we have less cattle and more people to feed.
The New World Screwworm invading the US is still a concern, as evidenced by the USDA’s announcement in the past week that they will begin aerial distribution of the sterilized larvae in a small part of TX and a larger swath of northern MX. As of this writing, screwworm has not been detected here in the US, as far as I know. Rumors pop up from time to time, but at this point that’s all they’ve been, unconfirmable rumors. At this stage, even if is does appear in the US, while prices might retrace immediately, in the long run, I think that would (eventually) be a bullish event.
Looking at the chart above, you might notice that the 5- and 10-day moving averages made a bullish crossover on January 28th. The 5-day (blue) is at 238.790 and the 10-day (red) is at 237.605 are both below the market and pointing higher. The 100-day average (grey) is at 232.260 or so, and is also (barely) inclined toward higher prices. The remaining averages on the chart, the 50- and 200-day (green/purple, respectively) are well below the market and also pointing upward. Stochastics (bottom sub-graph) have ticked back up into an overbought condition, but I don’t see that as concerning. It certainly appears on this 6-month view that Live Cattle prices have had no problem (and perhaps a preference) to being overbought, rather than oversold.
To my eye, the contract high, set October 16th of last year, is in play and a reasonable target. That contract high was 250.925. There is a price gap from that contract high day, at 249.175. My thought is if the market gets that close to 250.000, it’s likely to set new highs. I do know that some folks might be viewing that level as a “selling” level. I’m not certain today that establishing speculative short positions there would be wise. I’ll tell you what I think once we see prices there, but for now I think the bullish trend continues.
Aggressive and well-margined futures traders may do well to consider establishing long positions in this market. Perhaps consider an entry near either the 5-day or 10-day moving averages, which are at/near 238.800 and 237.600, respectively. I would suggest a protective sell-stop just under last week’s low of 235.600. If your stop is at 235.500, that would be a risk of 3.200 points or $1,320 per contract, before your commissions/fees, if you enter at today’s 5-day moving average price. For an upside target, I might suggest taking a profit at 250.000. From today’s 5-day moving average price, that would work out to a gain of 11.200 points or $4,480 per contract, before your commissions/fees.
Less aggressive traders may do well to consider long Call Option positions. Options for the April contract expire in 58 days. One way to go might be the April 240/250 Call spread (buying the April 240 call and selling the April 250 call. That spread settled at 3.60 today. Perhaps trying to enter that spread at 3.50 might work for you. That would cost $1,400 out-of-pocket, before your fees/commissions. Place a GTC order to exit that spread at 7.00, doubling what you spent, less commissions/fees. That strategy does limit your upside potential, as it’s a spread. If you prefer an “unlimited” ceiling, April 250 Calls closed at 2.025 today. Perhaps buying those at 2.00 ($800 out of pocket, plus commissions/fees) with an eye toward holding them would work for you.
For the cattle producers out there, your risk is to the downside. You should be aware of where your breakeven prices are and consider Put Spreads for downside protection. These types of positions offer less out-of-pocket costs, while still offering protection against random events or irresponsible public statements outside of market hours. Call me directly if you need ideas or suggestions.
April Live Cattle (Weekly)
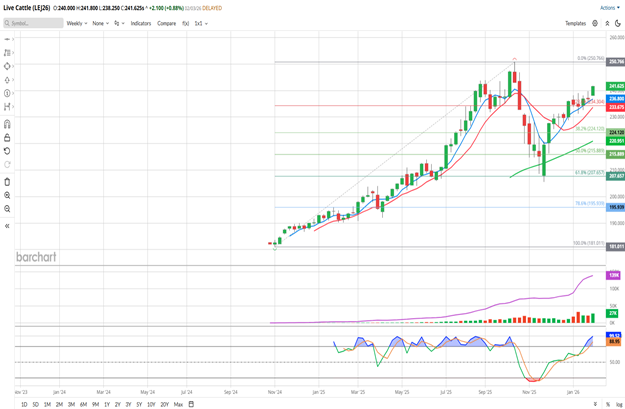
This weekly chart of the April Live Cattle contract looks like a healthy, bullish market to me. Last week’s bar was a bit of an “equilibrium bar” to my eye. Not quite a Doji, not quite a Spinning Top, for the candlestick traders out there. If this week’s trade maintains strength and closes Friday above last week’s high (239.750) I think the bulls will have gained a bit more control. Contract highs were made in October and the subsequent downturn held at the 62% Fibonacci retracement very well. I’ve added the Fibonacci retracement levels to the chart above, so perhaps you can see what I mean. The 5- and 10-week moving averages made a bullish crossover during the Christmas week and are both pointing toward higher prices. To my eye, the 5-week average has also held as good support since then. The 5-week average (blue, 236.800) hasn’t been tested so far this week, but neither has the 10-week moving average (red, 233.675). A close below either of those might change my outlook. The 50-week (green, 220.951 today) is well below the market price and has been pointing higher for all of its life. Stochastics (bottom sub-graph) have jumped back into overbought territory. You may notice that this market has seemingly preferred that over the past year. By my count, this market has spent 28 weeks being overbought (blue) and just 3 weeks were oversold (red). I’m not certain how long it will take, but I would expect new contract highs, based on the way this chart looks today.
Seasonally speaking, you can view Barchart’s data here. My seasonal charts indicate price strength until the last half of February, a pull-back into the first week of March, followed by a rally into contract expiration. Remember, the fundamental supply/demand is what’s driving this bull market. Due to that factor, the seasonal patterns may not be applicable every year.
If you’re viewing this on our site at WalshTrading.com, you’ll be able to see my seasonal chart below.
Sign Up to receive Walsh Trading’s 1st Half of 2026 Market Outlook First Half of 2026 Outlook for the Livestock and Grain markets.
If you like what you’ve read here and would like to see more like this from Walsh Trading, please Click here and sign up for our daily futures market email.
Jefferson Fosse Walsh Trading
Direct 312 957 8248 Toll Free 800 556 9411
jfosse@walshtrading.com www.walshtrading.com
Walsh Trading, Inc. is registered as a Guaranteed Introducing Broker with the Commodity Futures Trading Commission and an NFA Member.
Futures and options trading involves substantial risk and is not suitable for all investors. Therefore, individuals should carefully consider their financial condition in deciding whether to trade. Option traders should be aware that the exercise of a long option will result in a futures position. The valuation of futures and options may fluctuate, and as a result, clients may lose more than their original investment. The information contained on this site is the opinion of the writer or was obtained from sources cited within the commentary. The impact on market prices due to seasonal or market cycles and current news events may already be reflected in market prices. PAST PERFORMANCE IS NOT NECESSARILY INDICATIVE OF FUTURE RESULTS. All information, communications, publications, and reports, including this specific material, used and distributed by Walsh Trading, Inc. (“WTI”) shall be construed as a solicitation for entering into a derivatives transaction. WTI does not distribute research reports, employ research analysts, or maintain a research department as defined in CFTC Regulation 1.71.

/Microsoft%20Corporation%20logo%20on%20phone-by%20rafapress%20via%20Shuterstock.jpg)

/Advanced%20Micro%20Devices%20Inc_%20office%20sign-by%20Poetra_RH%20via%20Shutterstock.jpg)

/Quantum%20Computing/Image%20by%20Funtap%20via%20Shutterstock.jpg)