




Electronics manufacturing services provider Benchmark (NYSE:BHE) beat Wall Street’s revenue expectations in Q2 CY2026, with sales up 17.7% year on year to $756 million. On top of that, next quarter’s revenue guidance ($775 million at the midpoint) was surprisingly good and 4.1% above what analysts were expecting. Its non-GAAP profit of $0.75 per share was 9.2% above analysts’ consensus estimates.
Is now the time to buy Benchmark? Find out by accessing our full research report, it’s free.
Benchmark (BHE) Q2 CY2026 Highlights:
- Revenue: $756 million vs analyst estimates of $720 million (17.7% year-on-year growth, 5% beat)
- Adjusted EPS: $0.75 vs analyst estimates of $0.69 (9.2% beat)
- Revenue Guidance for Q3 CY2026 is $775 million at the midpoint, above analyst estimates of $744.3 million
- Adjusted EPS guidance for Q3 CY2026 is $0.79 at the midpoint, above analyst estimates of $0.72
- Operating Margin: 4%, in line with the same quarter last year
- Free Cash Flow was $21.75 million, up from -$13.82 million in the same quarter last year
- Market Capitalization: $2.76 billion
"Our second quarter results reflect continued momentum across the business, highlighted by revenue and earnings above the high end of our prior guidance along with another record quarter of bookings,” said David Moezidis, Benchmark’s President and CEO.
Company Overview
Operating as a critical behind-the-scenes partner for complex technology products since 1979, Benchmark Electronics (NYSE:BHE) provides advanced manufacturing, engineering, and technology solutions for original equipment manufacturers across aerospace, medical, industrial, and technology sectors.
Revenue Growth
Examining a company’s long-term performance can provide clues about its quality. Any business can experience short-term success, but top-performing ones enjoy sustained growth for years.
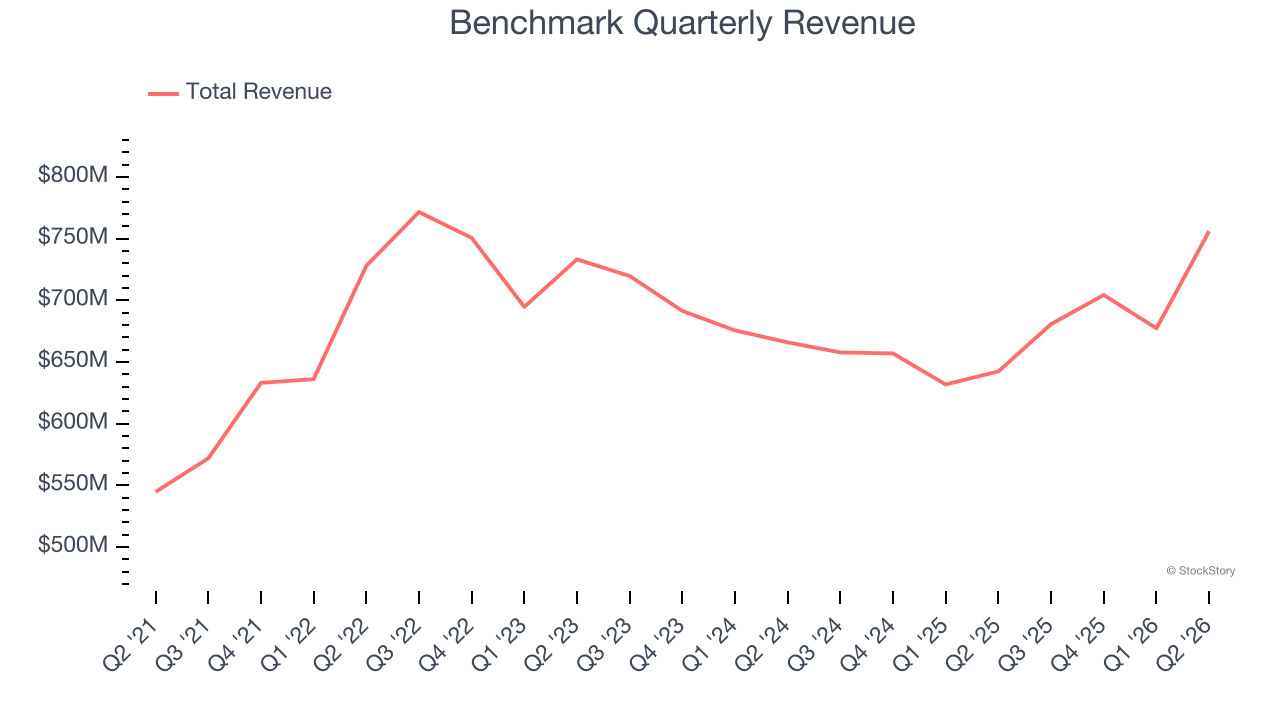
With $2.82 billion in revenue over the past 12 months, Benchmark is a mid-sized business services company, which sometimes brings disadvantages compared to larger competitors benefiting from better economies of scale. On the bright side, it can still flex high growth rates because it’s working from a smaller revenue base.
As you can see below, Benchmark grew its sales at a decent 6.1% compounded annual growth rate over the last five years. This shows its offerings generated slightly more demand than the average business services company, a useful starting point for our analysis.
Long-term growth is the most important, but within business services, a half-decade historical view may miss new innovations or demand cycles. Benchmark’s recent performance shows its demand has slowed as its annualized revenue growth of 1.2% over the last two years was below its five-year trend. We’re wary when companies in the sector see decelerations in revenue growth, as it could signal changing consumer tastes aided by low switching costs. 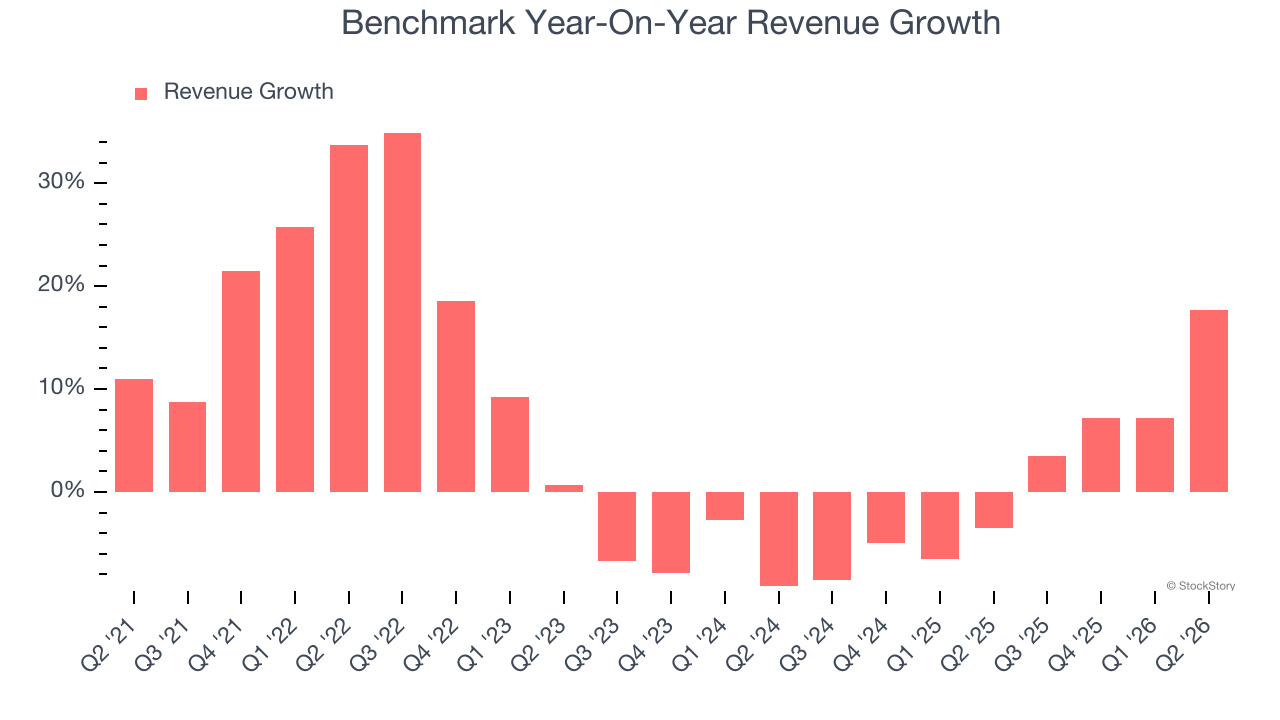
This quarter, Benchmark reported year-on-year revenue growth of 17.7%, and its $756 million of revenue exceeded Wall Street’s estimates by 5%. Company management is currently guiding for a 13.9% year-on-year increase in sales next quarter.
Looking further ahead, sell-side analysts expect revenue to grow 6.8% over the next 12 months, an improvement versus the last two years. This projection is above the sector average and indicates its newer products and services will catalyze better top-line performance.
ONE MORE THING: 3 Hidden Platforms Growing 3X Faster than Amazon, Google, and PayPal. Amazon, Google, and Meta all followed the same playbook: Dominate an ignored market. Build an unbeatable moat. Scale until you’re unstoppable.
These three platforms are running that exact playbook right now. The early investors in Amazon made fortunes. The early investors in these could do the same. Get All 3 Stocks Here for FREE.
Adjusted Operating Margin
Adjusted operating margin is an important measure of profitability as it shows the portion of revenue left after accounting for all core expenses — everything from the cost of goods sold to advertising and wages. It’s also useful for comparing profitability across companies because it excludes non-recurring expenses, interest on debt, and taxes.
Benchmark’s adjusted operating margin has generally stayed the same over the last 12 months, averaging 4.3% over the last five years. This profitability was lousy for a business services business and caused by its suboptimal cost structure.
Looking at the trend in its profitability, Benchmark’s adjusted operating margin might have fluctuated slightly but has generally stayed the same over the last five years. This raises questions about the company’s expense base because its revenue growth should have given it leverage on its fixed costs, resulting in better economies of scale and profitability.
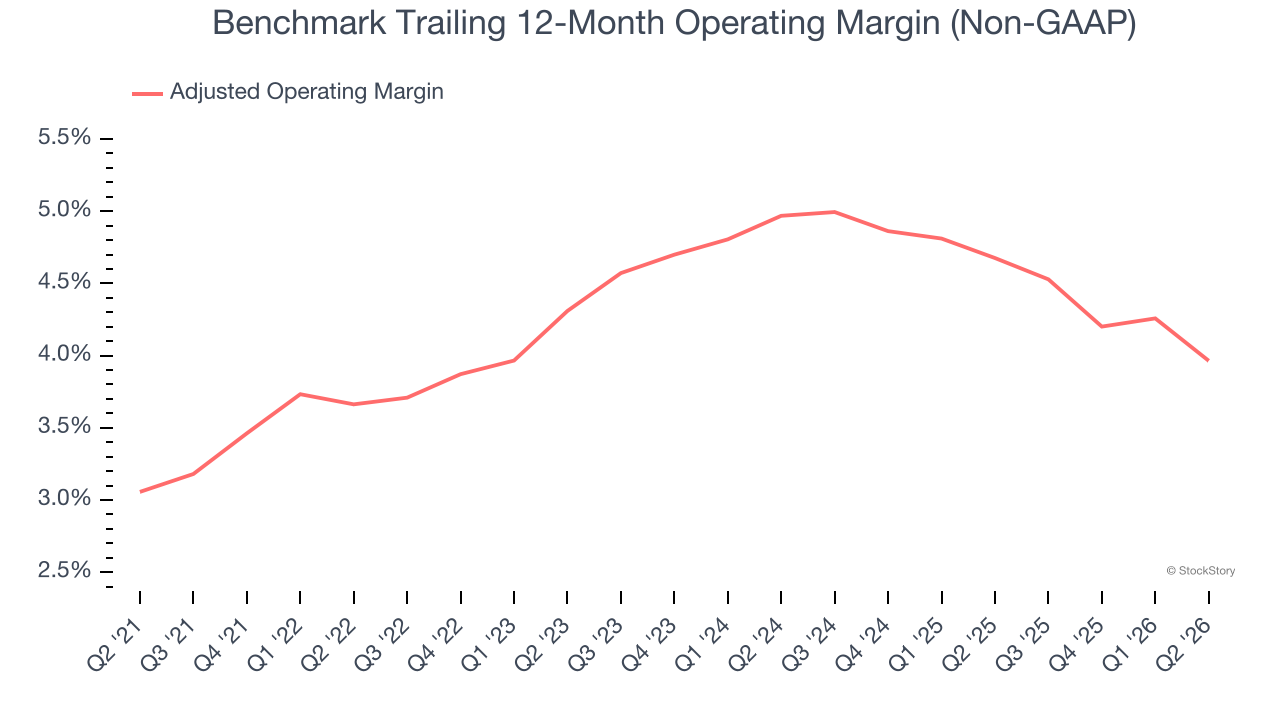
This quarter, Benchmark generated an adjusted operating margin profit margin of 3.3%, down 1.1 percentage points year on year. This reduction is quite minuscule and indicates the company’s overall cost structure has been relatively stable.
Earnings Per Share
We track the long-term change in earnings per share (EPS) for the same reason as long-term revenue growth. Compared to revenue, however, EPS highlights whether a company’s growth is profitable.
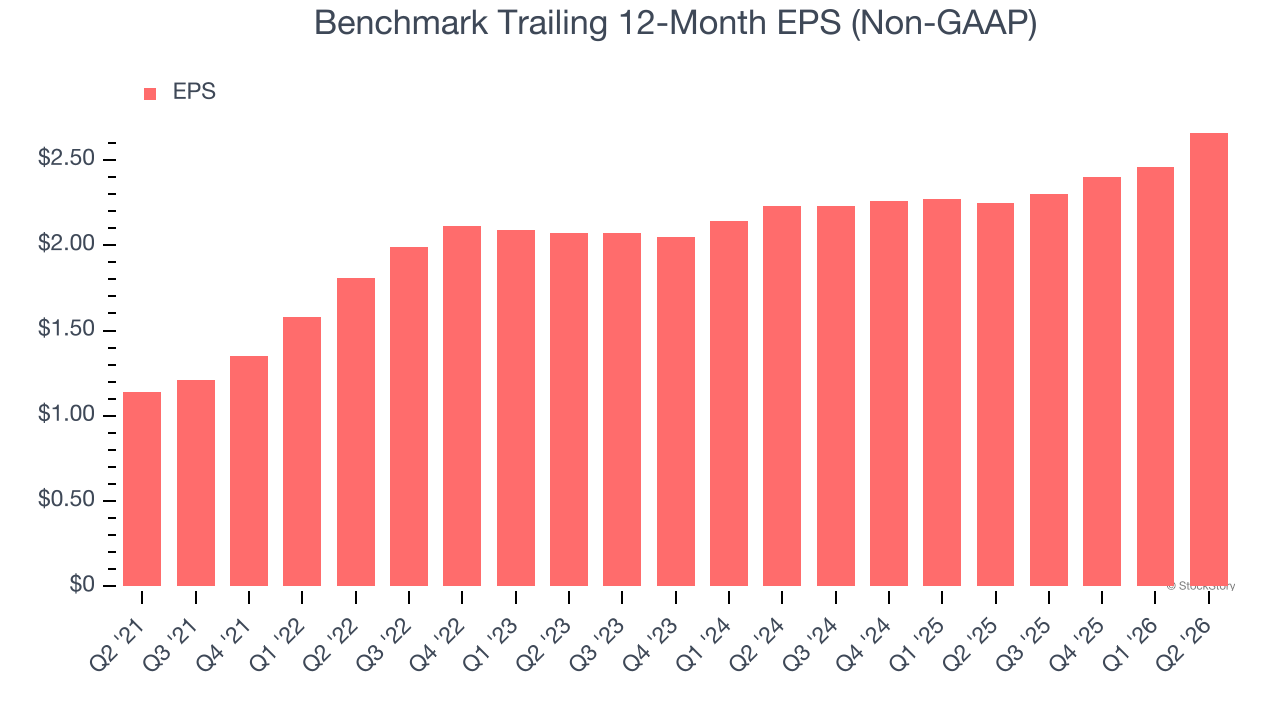
Benchmark’s EPS grew at 18.5% compounded annual growth rate over the last five years, higher than its 6.1% annualized revenue growth. However, we take this with a grain of salt because its adjusted operating margin didn’t improve and it didn’t repurchase its shares, meaning the delta came from reduced interest expenses or taxes.
Like with revenue, we analyze EPS over a more recent period because it can provide insight into an emerging theme or development for the business.
For Benchmark, its two-year annual EPS growth of 9.2% was lower than its five-year trend. We hope its growth can accelerate in the future.
In Q2, Benchmark reported adjusted EPS of $0.75, up from $0.55 in the same quarter last year. This print beat analysts’ estimates by 9.2%. Over the next 12 months, Wall Street expects Benchmark’s full-year EPS to grow 10.8% from $2.66 to $2.95.
Key Takeaways from Benchmark’s Q2 Results
We were impressed by how significantly Benchmark blew past analysts’ EPS guidance for next quarter expectations this quarter. We were also glad its revenue guidance for next quarter trumped Wall Street’s estimates. Zooming out, we think this quarter featured some important positives. The stock traded up 6.6% to $79 immediately after reporting.
Benchmark may have had a good quarter, but does that mean you should invest right now? The latest quarter does matter, but not nearly as much as longer-term fundamentals and valuation, when deciding if the stock is a buy. We cover that in our actionable full research report which you can read here (it’s free).



/An%20Intel%20sign%20out%20front%20of%20a%20corporate%20office%20by%20wolterke%20via%20Adobe%20Stock.jpeg)
