Watch us on RFD-TV, today at 12:45pm CT!
Live Cattle
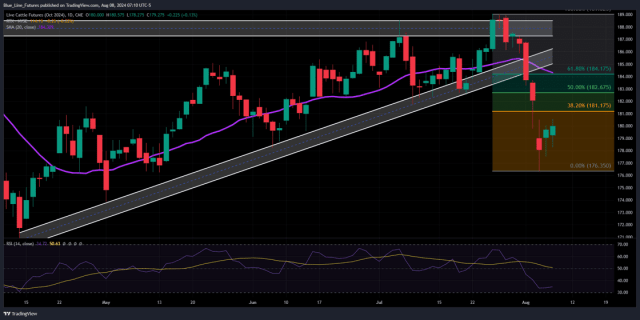
Technicals (October – V) October live cattle futures continued to trade in a choppy manner but did tack on some gains at the close. Fear in the outside markets has subsided some which has calmed the nerves some. First resistance for today’s trade comes in from 180.575-181.175. If the Bulls can chew through that pocket a retest of the 50% retracement (the midpoint of the recent high to low) could be in order, that comes in at 182.675. We continue to be in the camp that relief rallies are likely to be viewed as selling opportunities, particularly in the back months and for those who need to protect/hedge the physical. On the support side of things,
- Resistance: 180.575-181.175, 182.675-183.275*
- Pivot: 179.35-180.50
- Support: 176.35-176.22***
Weekly Export Sales
Beef: Net sales of 10,000 MT for 2024 were down 43 percent from the previous week and 27 percent from the prior 4-week average.
Daily Livestock Summary
Yesterday’s cutout values were softer with choice cuts down 1.96 to 313.85 and select cuts down .79 to 298.83. The 5-area average price for live steers was reported at 192.67. Daily slaughter came in at 122k head, in line with last week and last year. Week to date slaughter stands at 363k head.
Below: Daily chart of October live cattle which illustrates the accelerated selling pressure following the breakdown of trendline support. Also included is a set of Fibonacci retracements from the high to low of the recent move.
Feeder Cattle
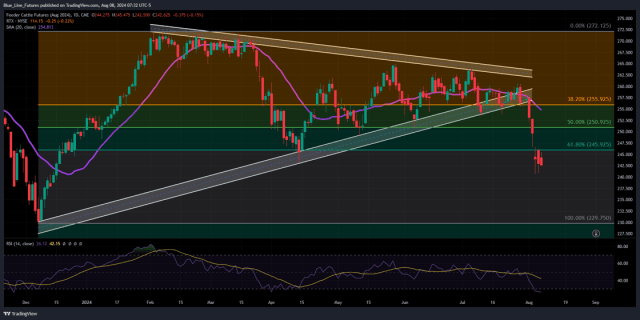
Technicals (August – Q) August feeder cattle futures posted their second consecutive inside day (trading within the previous day’s range). Despite the consolidation in the last two sessions, the RSI remains in oversold territory with a reading of 26.12, the lowest since last November, which was right before the last dip lower before posting a low on December 7th. The lowest RSI during that time frame was 24.68. Is the RSI a good enough reason to be Bullish from these levels, short answer is no. With that said, we continue to believe we could see some relief from these levels that may setup for another opportunity to the sell side for those with a bearish bias or for those that need to hedge. The CME CVOL index, a measure of volatility, is at its highest levels since the Spring, it would be nice to see that subside which could help options become a little less expensive. The chart below includes a set of Fibonacci retracements from this year’s range. Not illustrated is a Fib retracement from the recent selloff, the halfway back point on that would come in near 249.15.
- Resistance: 245.925-246.675, 249.15-250.92*
- Pivot: 244.275
- Support:240.775-240.925, 237.80-237.97* 229.50*
Below: Daily chart of August feeder cattle that illustrates the accelerated selling pressure that took place following a break below trendline support. Also included is a set of Fibonacci retracements from this year’s trading range.
Want to keep reading?
Subscribe to our daily Livestock Roundup for daily insights into Feeder Cattle, Live Cattle, and Lean Hogs technicals, including our proprietary trading levels, and actionable market bias.
https://bluelinefutures.com/2023-signup/?utm_source=Oliver-Sloup-Barchart
Futures trading involves substantial risk of loss and may not be suitable for all investors. Therefore, carefully consider whether such trading is suitable for you in light of your financial condition. Trading advice is based on information taken from trade and statistical services and other sources Blue Line Futures, LLC believes are reliable. We do not guarantee that such information is accurate or complete and it should not be relied upon as such. Trading advice reflects our good faith judgment at a specific time and is subject to change without notice. There is no guarantee that the advice we give will result in profitable trades. All trading decisions will be made by the account holder. Past performance is not necessarily indicative of future results.
Blue Line Futures is a member of NFA and is subject to NFA’s regulatory oversight and examinations. However, you should be aware that the NFA does not have regulatory oversight authority over underlying or spot virtual currency products or transactions or virtual currency exchanges, custodians or markets. Therefore, carefully consider whether such trading is suitable for you considering your financial condition.
With Cyber-attacks on the rise, attacking firms in the healthcare, financial, energy and other state and global sectors, Blue Line Futures wants you to be safe! Blue Line Futures will never contact you via a third party application. Blue Line Futures employees use only firm authorized email addresses and phone numbers. If you are contacted by any person and want to confirm identity please reach out to us at info@bluelinefutures.com or call us at 312- 278-0500
Performance Disclaimer
Hypothetical performance results have many inherent limitations, some of which are described below. No representation is being made that any account will or is likely to achieve profits or losses similar to those shown. In fact, there are frequently sharp differences between hypothetical performance results and the actual results subsequently achieved by any particular trading program.
One of the limitations of hypothetical performance results is that they are generally prepared with the benefit of hindsight. In addition, hypothetical trading does not involve financial risk, and no hypothetical trading record can completely account for the impact of financial risk in actual trading. For example, the ability to withstand losses or to adhere to a particular trading program in spite of trading losses are material points which can also adversely affect actual trading results. There are numerous other factors related to the markets in general or to the implementation of any specific trading program which cannot be fully accounted for in the preparation of hypothetical performance results and all of which can adversely affect actual trading results.
On the date of publication, Oliver Sloup did not have (either directly or indirectly) positions in any of the securities mentioned in this article. All information and data in this article is solely for informational purposes. For more information please view the Barchart Disclosure Policy here.

/Technology%20abstract%20by%20TU%20IS%20via%20iStock.jpg)


/Micron%20Technology%20Inc_%20logo%20on%20building-by%20vzphotos%20vis%20iStock.jpg)