Chart of the Day
The information and opinions expressed below are based on my analysis of price behavior and chart activity
Sign Up to receive Walsh Trading’s 1st Half of 2026 Market Outlook First Half of 2026 Outlook for the Livestock and Grain markets.
Thursday, February 12, 2026
If you like this article and would like to receive more information on the commodity markets from Walsh Trading, please use the link to join our daily email list -Click here
May Soybeans (Daily)
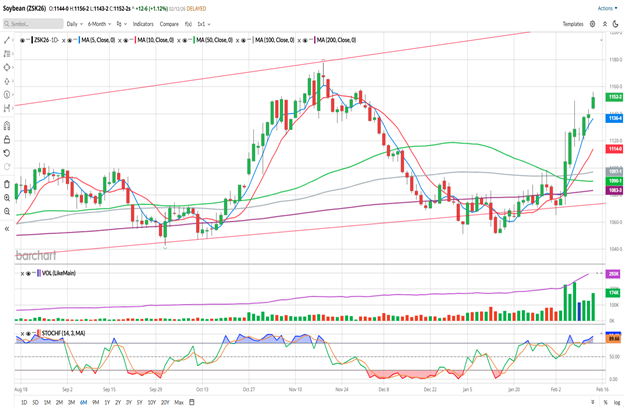
(March Beans are still the “front month”, but Open Interest has shifted to the May contract, ahead of Option Expiration and First Notice Day for the March, next 2 Fridays, respectively)
Today, May Soybeans closed at 11.52 ¼, up 12 ¾ cents on the day. That’s the highest close since November 28th. The market did gap higher on the open last night, but did retrace to fill that in. Tomorrow is Friday and the market has been higher all week, so it is possible that things turn lower on some profit taking ahead of the long weekend. Grain markets will be closed on Monday for President’s Day.
Technically speaking, the market does seem strong to my eye. The 5- and 10-day moving averages (blue/red) have been in a bullish configuration since January 22nd. It did take a tweet from President Trump to accelerate the price activity last week, but the bullish recovery was already underway. Currently, those averages are at 11.36 ½ and 11.14, respectively, offering potential support levels. Both of those averages are inclined, as is the 100-day moving average (grey, 10.97 1/8) and the 200-day (purple, 10.83 3/8) The 50-day average (green, 10.90 1/8) is flat, compared to yesterday, but is has been declining for about a month. In fact, the 50- and 100-day averages made a bearish crossover last week, the day before May Beans rallied some 27 ½ cents. Volume today was fairly strong, but not quite to the levels we saw a week ago, on Wednesday and Friday. Stochastics (bottom sub-graph) ticked back up into an overbought condition. You may notice that when this market appears to be trending, it does seem to prefer being either overbought or oversold. Most notably, to me anyhow, during Oct-Nov and most of Dec. And if you look back to October 20th, you might notice that it ticked up into overbought, traded back lower, and then resumed the uptrend and stayed strong until November 18th. The last week, or so, looks very similar but we’ll have to stay tuned to see if it repeats the pattern.
Following the strong rally late last week, the market did post a Doji on Monday of this week. Typically, that indicates a point of price equilibrium to me. The Bulls had a chance to rally, the Bears had a chance to break it, nobody “won” so the market cam back to where it started. Usually, I look for the next directional close outside of that day’s range for the next directional push. In this case, a close above 11.29 ¾ or a close below 11.20, which was Monday’s range. Tuesday’s close was 11.37 ½, indicating to me that the next directional move should be higher. 5-day moving average held as support on Tuesday and Wednesday of this week, but wasn’t tested today.
There has been much talk over the past week about China, thanks to the social media post from Trump. Many analysts seem to think that China won’t be a buyer of US Soybeans because of the large crop currently being harvested in Brazil. I get that point of view. Why would they pay a higher price for US Beans, when they can go to South America? Makes good economic sense, I think. However, I’ll add to that that these are HUGE government budgets that we’re dealing with and the amount of money that they’ll pay up for US Beans might work out to be a rounding error on a government balance sheet. And when we’re talking about any government spending, ours, theirs, any government, really, often make zero financial sense to normies like us. It does seem to me that both sides are playing nice with each other, ahead of a face-to-face meeting in April. Barring some outside event, I would expect that condition to continue until Trump and Xi meet.
May Soybeans (Weekly)
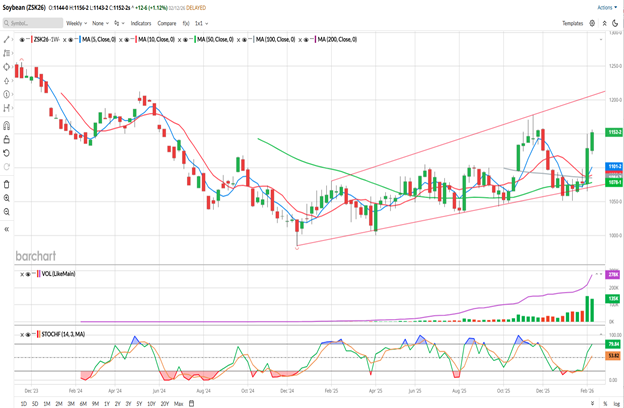
So far for the week, May Soybeans have gained 23 ½ cents. That’s less than half of the 51 ¾ cent gain last week, but there’s still tomorrow and social media is open 24/7, should Trump weigh in again. You might notice, by looking at the weekly chart above, that the Bean market has been in an uptrend since making the contract low in mid-December 2024. There have been a series of higher highs and higher lows since then. Not a huge, vertical rally, but a gain of $1.68 over the past 14 months. The lower trendline that I’ve drawn on the chart, from the contract low to the August 2025 low, has been tested for the better part of the past 2 months and has held as support. The upper trendline, drawn off of the February high and the high in November is currently at, roughly, the 12.00 level and may be the next target for the bulls. The 5- and 10-week moving averages (blue/red) have made a bullish crossover this week. Those are offering potential weekly support levels at 11.01 ¼ and 10.89, respectively. Volume has increased over the past 2 weeks, partially due to contract rollover, but mostly due to renewed bullish interest, I think. Stochastics are pointing higher, but are not yet in an overbought condition.
Seasonals are mixed, I think. According to Barchart’s Seasonal Data prices generally stay firm throughout February, March and April. The seasonal charts that I look at suggest a choppy period ahead, especially over the past 5 years, but the 15 and 30 year patterns suggest more strength ahead. I have 2 caveats though: First, the world supply/demand picture has changed in a large way over the past 10 years and those longer term patterns may no longer be valid. Second, when a market is in a strong trend, seasonals and fundamentals get tossed out the window, in favor of directional momentum.
So how can you trade it?
Very aggressive and well-margined traders may do well to consider establishing long futures positions. The 5-day moving average has held as support for the past 4 weeks or so. Perhaps an entry there would work for you. Today, that average is at 11.36 ½, but it will move higher with tonight’s open, assuming the market doesn’t crater between now and 7 PM CT. Normally, I’d suggest a protective Sell-Stop order, but as I don’t know your account size or risk tolerance, I’ll leave the entry and risk up to you. An upside target near the 12.00 mark (nice, big, fat round number) could offer a nice gain from here. Currently, I think there will be a lot of selling pressure there, due to hedge pressure or farmer selling. But perception matters more than reality, sometimes, and if China confirms more buying, prices could blow through there with no problem.
Farmers that are looking to re-own bushels that they’ve sold, or less aggressive speculators may do well to consider long Call Option positions. May options expire in 71 days. 12.00 calls settled at 18 5/8 today, or $931.25 before your commissions/fees. I would suggest placing a GTC order at 2x what you paid for the options.
Another approach might be a Bullish Call Spread. The 12.00/12.50 Call Spread settled at about 9 cents difference today. That would reduce your out-of-pocket cost to $450 before commissions/fees. I would also suggest placing a GTC order to exit that spread at 30 cents. That would work out to a potential profit of 21 cents, or $1,050, before your commissions and fees.
Sign Up to receive Walsh Trading’s 1st Half of 2026 Market Outlook First Half of 2026 Outlook for the Livestock and Grain markets.
If you like what you’ve read here and would like to see more like this from Walsh Trading, please Click here and sign up for our daily futures market email.
Jefferson Fosse Walsh Trading
Direct 312 957 8248 Toll Free 800 556 9411
jfosse@walshtrading.com www.walshtrading.com
Walsh Trading, Inc. is registered as a Guaranteed Introducing Broker with the Commodity Futures Trading Commission and an NFA Member.
Futures and options trading involves substantial risk and is not suitable for all investors. Therefore, individuals should carefully consider their financial condition in deciding whether to trade. Option traders should be aware that the exercise of a long option will result in a futures position. The valuation of futures and options may fluctuate, and as a result, clients may lose more than their original investment. The information contained on this site is the opinion of the writer or was obtained from sources cited within the commentary. The impact on market prices due to seasonal or market cycles and current news events may already be reflected in market prices. PAST PERFORMANCE IS NOT NECESSARILY INDICATIVE OF FUTURE RESULTS. All information, communications, publications, and reports, including this specific material, used and distributed by Walsh Trading, Inc. (“WTI”) shall be construed as a solicitation for entering into a derivatives transaction. WTI does not distribute research reports, employ research analysts, or maintain a research department as defined in CFTC Regulation 1.71.


/Elon%20Musk%2C%20founder%2C%20CEO%2C%20and%20chief%20engineer%20of%20SpaceX%2C%20CEO%20of%20Tesla%20by%20Frederic%20Legrand%20-%20COMEO%20via%20Shutterstock.jpg)
