The dollar index measures the U.S. dollar against the other worldwide reserve currencies. The index comprises the dollar versus the euro, British pound, Japanese yen, Canadian dollar, Swedish krona, and Swiss franc, but its primary exposure is 57.6% against the euro, the second-leading worldwide reserve foreign exchange instrument.
Over the past decades, the dollar has had a dominant role in worldwide trade. The bifurcation of the world’s nuclear powers and the potential for a BRICS currency to challenge the U.S. dollar could change the global financial landscape. Meanwhile, the dollar index remains a barometer of the U.S. currency’s strength or weakness versus the currencies of allied countries.
Interest rate differentials lifted the dollar index to a two-decade high
The Fed began increasing the short-term Fed Funds Rate in March 2022. Simultaneously, the central bank started reducing its swollen balance sheet through quantitative tightening, increasing rates further out on the yield curve. Higher rates pushed the dollar index to the highest level since 2002 as rate differentials between the U.S. currency and components of the U.S. dollar index experienced a significant widening.
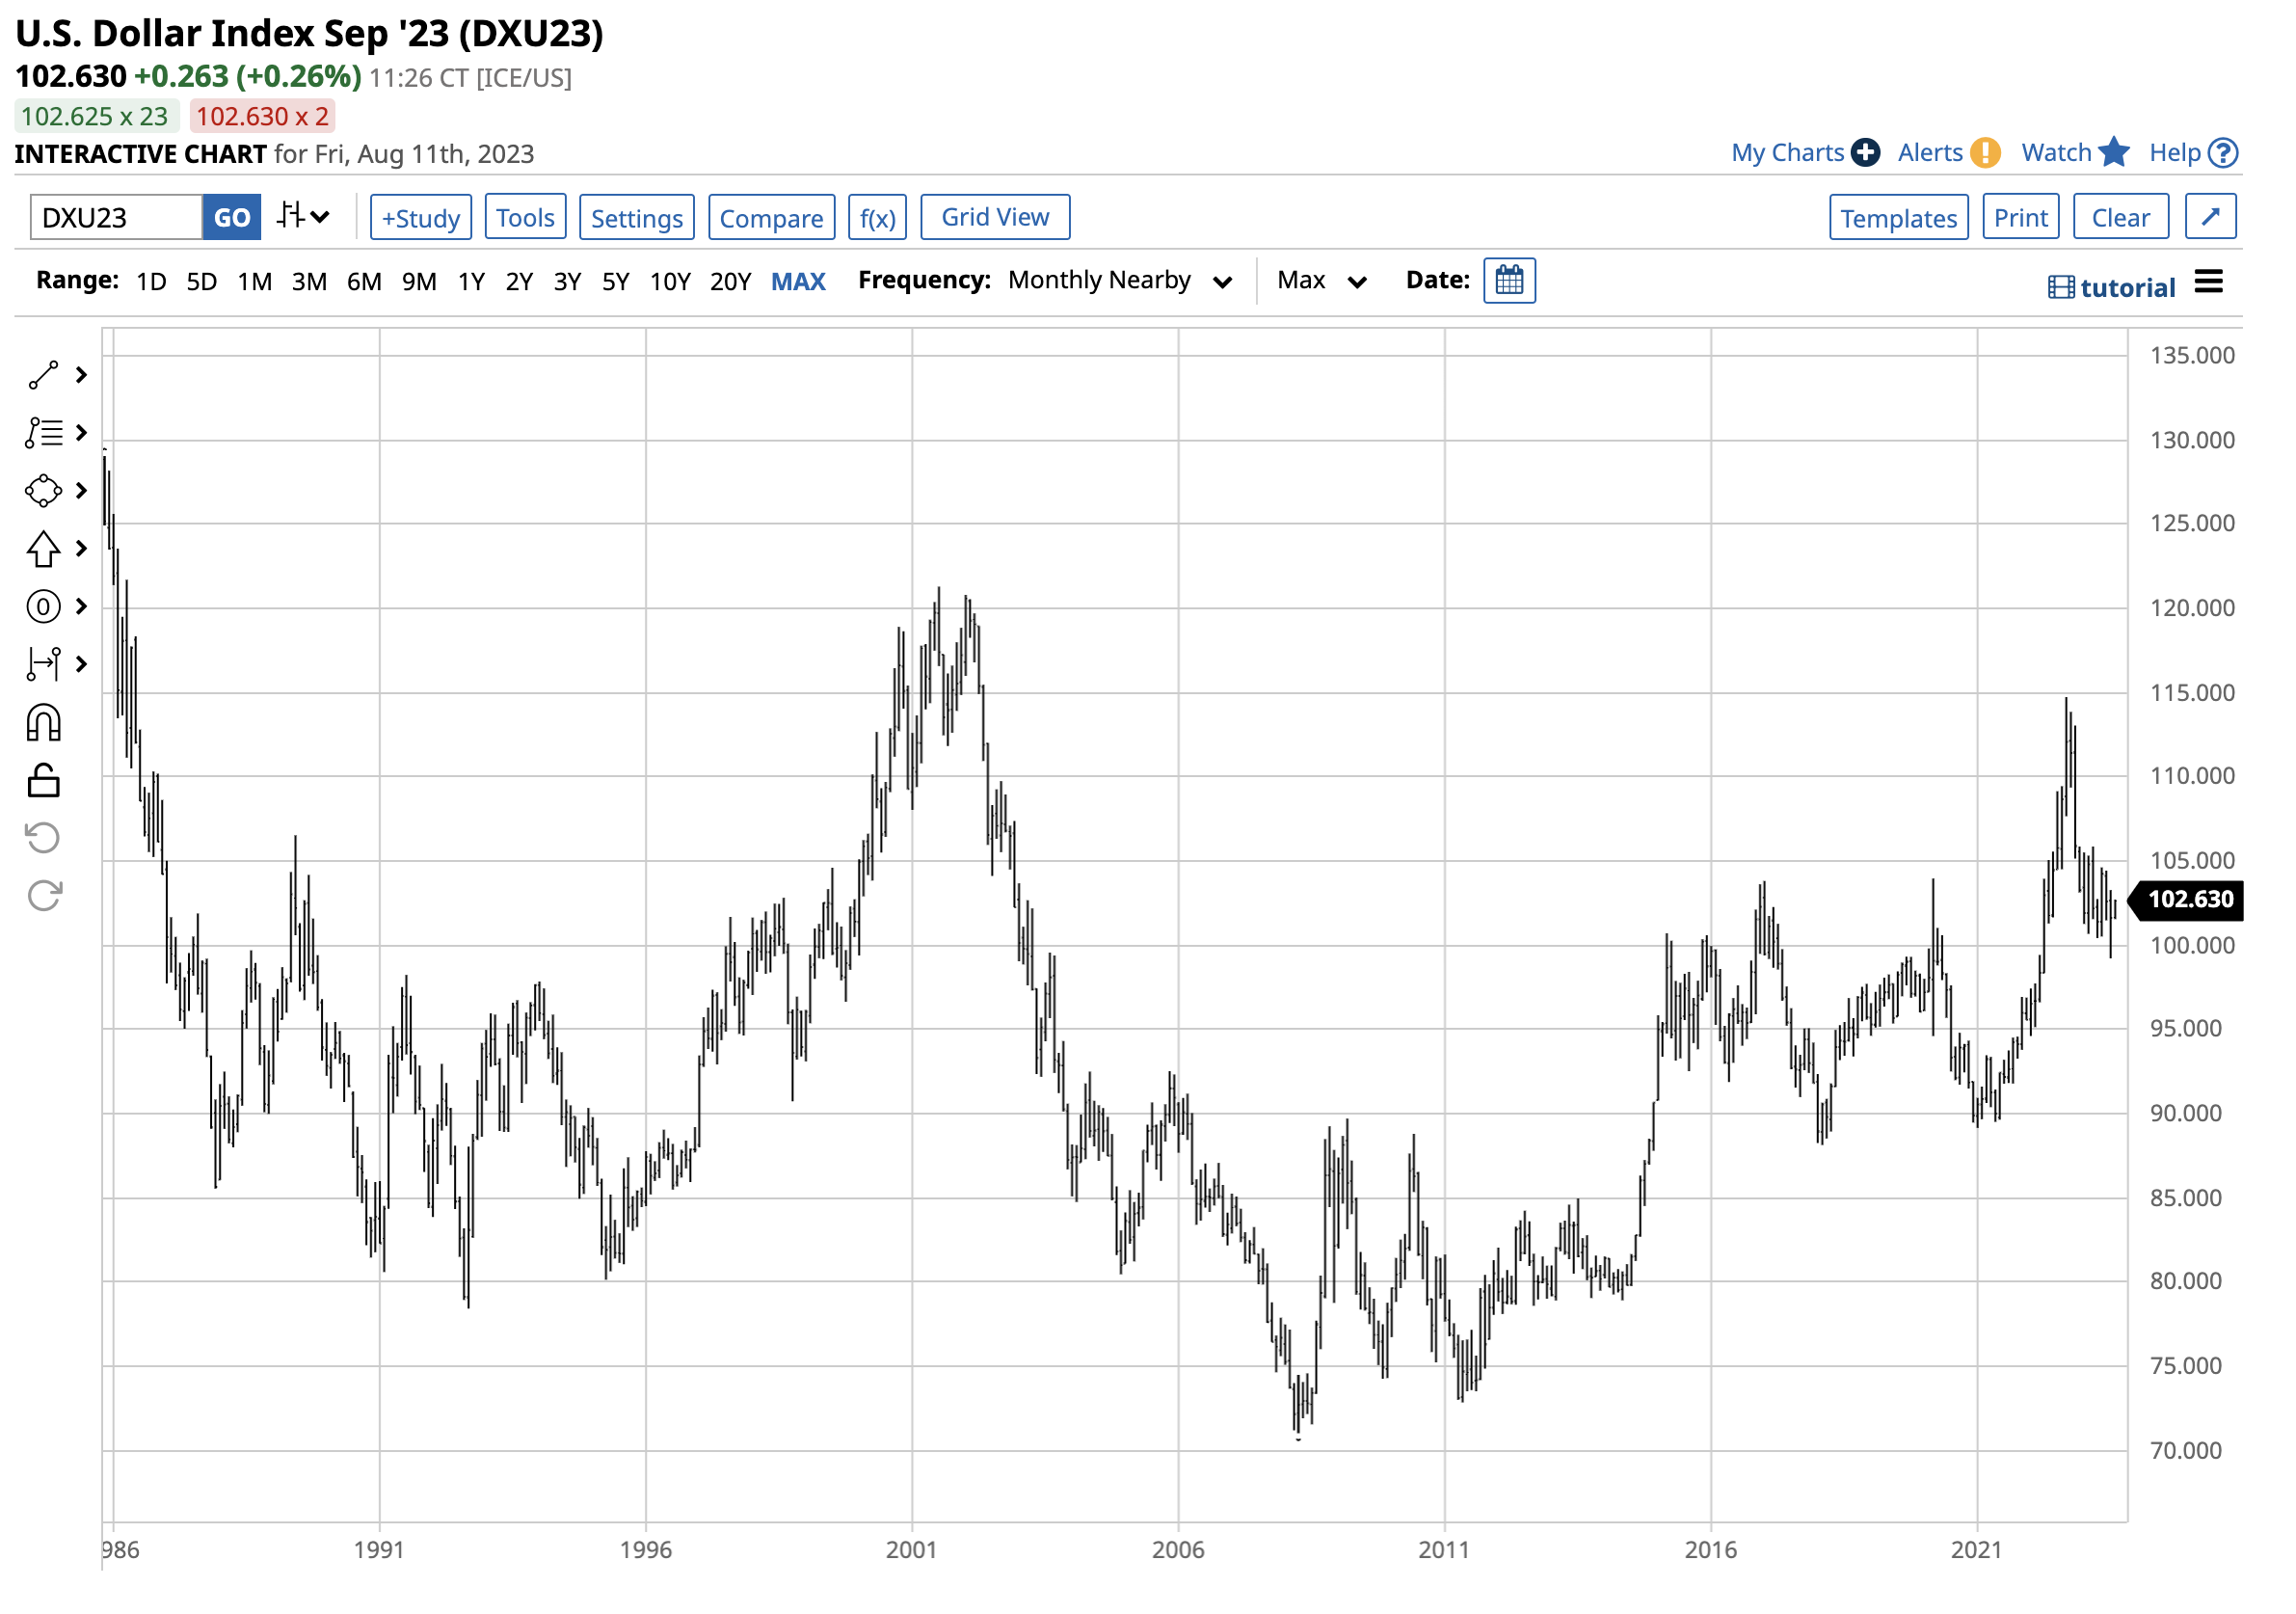
The long-term chart highlights the rise to 114.745, where the dollar index ran out of upside steam. The index fell below the 100 level in July 2023 and was under 103 on Friday, August 11.
Inflation data may not support a higher dollar index
Over the past months, inflation data has been trending lower, taking pressure off the U.S. central bank to increase interest rates aggressively. The July consumer price index data showed the inflation indicator rose a less-than-expected 3.2%. Core CPI ran at a twelve-month rate of 4.7% as both measures were 0.20% higher on the month.
On Friday, August 11, the July producer price index showed that wholesale prices increased 0.3% in July, higher than the 0.2% consensus forecast. On a year-on-year basis, the headline PPI rose 0.8%. Prices excluding food and energy moved up by 2.7%. While CPI was lower, PPI was slightly higher than the market’s expectation, but over the past months, inflation has been trending lower.
The Fed’s commitment to a 2% inflation target could mean small rate increases
The trend in the critical inflation indicators means the central bank is less likely to push interest rates significantly higher from the current 5.375% level. Meanwhile, with inflation over double the Fed’s 2% target, another 25 basis point Fed Funds Rate increase is possible. Still, the central bank may pause rate increases until the August data becomes available in early September. After increasing rates by 5.375% over fifteen months, the Fed’s job appears to have quelled some inflationary pressures.
The Fed will either push rates slightly higher and offer more dovish commentary or pause and continue its hawkish squawking over the coming months and throughout the rest of 2023. However, the odds of a rate cut are low until inflation approaches the central bank’s 2% goal.
A long consolidation period could be on the horizon
Since rates are critical for the forex rate differentials between the dollar and the dollar index components, and the data will cause the central bank to curb its enthusiasm for significant Fed Funds Rate increases, expect static price action in the dollar index. I expect the index to sit within the 100 to 105 trading band for the rest of 2023 based on a stable to marginally higher Fed Funds Rate.
Meanwhile, geopolitical events or sudden economic shocks could cause spikes from the current trading range. Markets reflect the economic and geopolitical landscapes, which remain highly turbulent in August 2023. The U.S. dollar remains the world’s reserve currency, so any surprises that cause a flight to quality would likely support the U.S. currency. Meanwhile, the bifurcation of the world’s nuclear powers has led to calls for a BRICS currency to challenge the dollar’s dominant role in global trade.
Critical support and resistance levels are far away from the current 102 level
While the 100 level is the dollar index’s critical psychological barrier, crucial technical support is far below the century mark, and resistance is well above.

The twenty-year dollar index chart shows support at the January 2021 89.165 low with resistance at the September 2022 114.745 high. Ironically, the midpoint between technical support and resistance is 101.955, and the index was sitting at the 102.690 level on Friday, August 11.
I expect the dollar index to hug the midpoint, which could be a significant pivot point throughout the rest of 2023, barring any unforeseen political or economic events.
On July 12, in a Barchart article, I wrote the dollar index was stuck in neutral at 103.645. The U.S. currency has not moved much, and the odds favor a continuation of range-bound trading. The changing geopolitical landscape continues to challenge the dollar’s position even if the index remains stable as the index only measures the U.S. currency against allied foreign exchange instruments that do not include the BRICS countries that could pose a significant threat for the future.
More Forex News from Barchart
- Cracking the Currency Code: Analyzing Seasonal Patterns and the Future of the British Pound
- Dollar Rallies on Higher Bond Yields and a Weak Yuan
- Will the Digital Asset Boom be Bigger Than the Internet?
- Stocks Waver on Mixed U.S. Economic News
On the date of publication, Andrew Hecht did not have (either directly or indirectly) positions in any of the securities mentioned in this article. All information and data in this article is solely for informational purposes. For more information please view the Barchart Disclosure Policy here.

/Nvidia%20logo%20by%20Konstantin%20Savusia%20via%20Shutterstock.jpg)

/Apple%20products%20on%20desk%20by%20Ake%20Ngiamsanguan%20via%20iStock.jpg)
/McDonald's%20Corp%20arches%20by-%20TonyBaggett%20via%20iStock.jpg)