In a January 29, 2023, Barchart article, I highlighted the long-term bullish gold trend, writing, “In markets, the trend is always your best friend, and gold remains in a bullish long-term trend in early 2023.” Bull markets rarely move in straight lines, and gold peaked on February 2, when the continuous contract traded to $1,959.10, and the active month April COMEX futures hit $1,975.20 per ounce. Since then, gold has dropped more than $140 per ounce.
Long-term bull markets rarely move in straight lines, and corrections are the norm, not the exception. Buying gold during these periodic selloffs has been the optimal approach since 1999.
A correction takes gold lower
After trading just over the $1975 level, April COMEX gold futures pulled back.
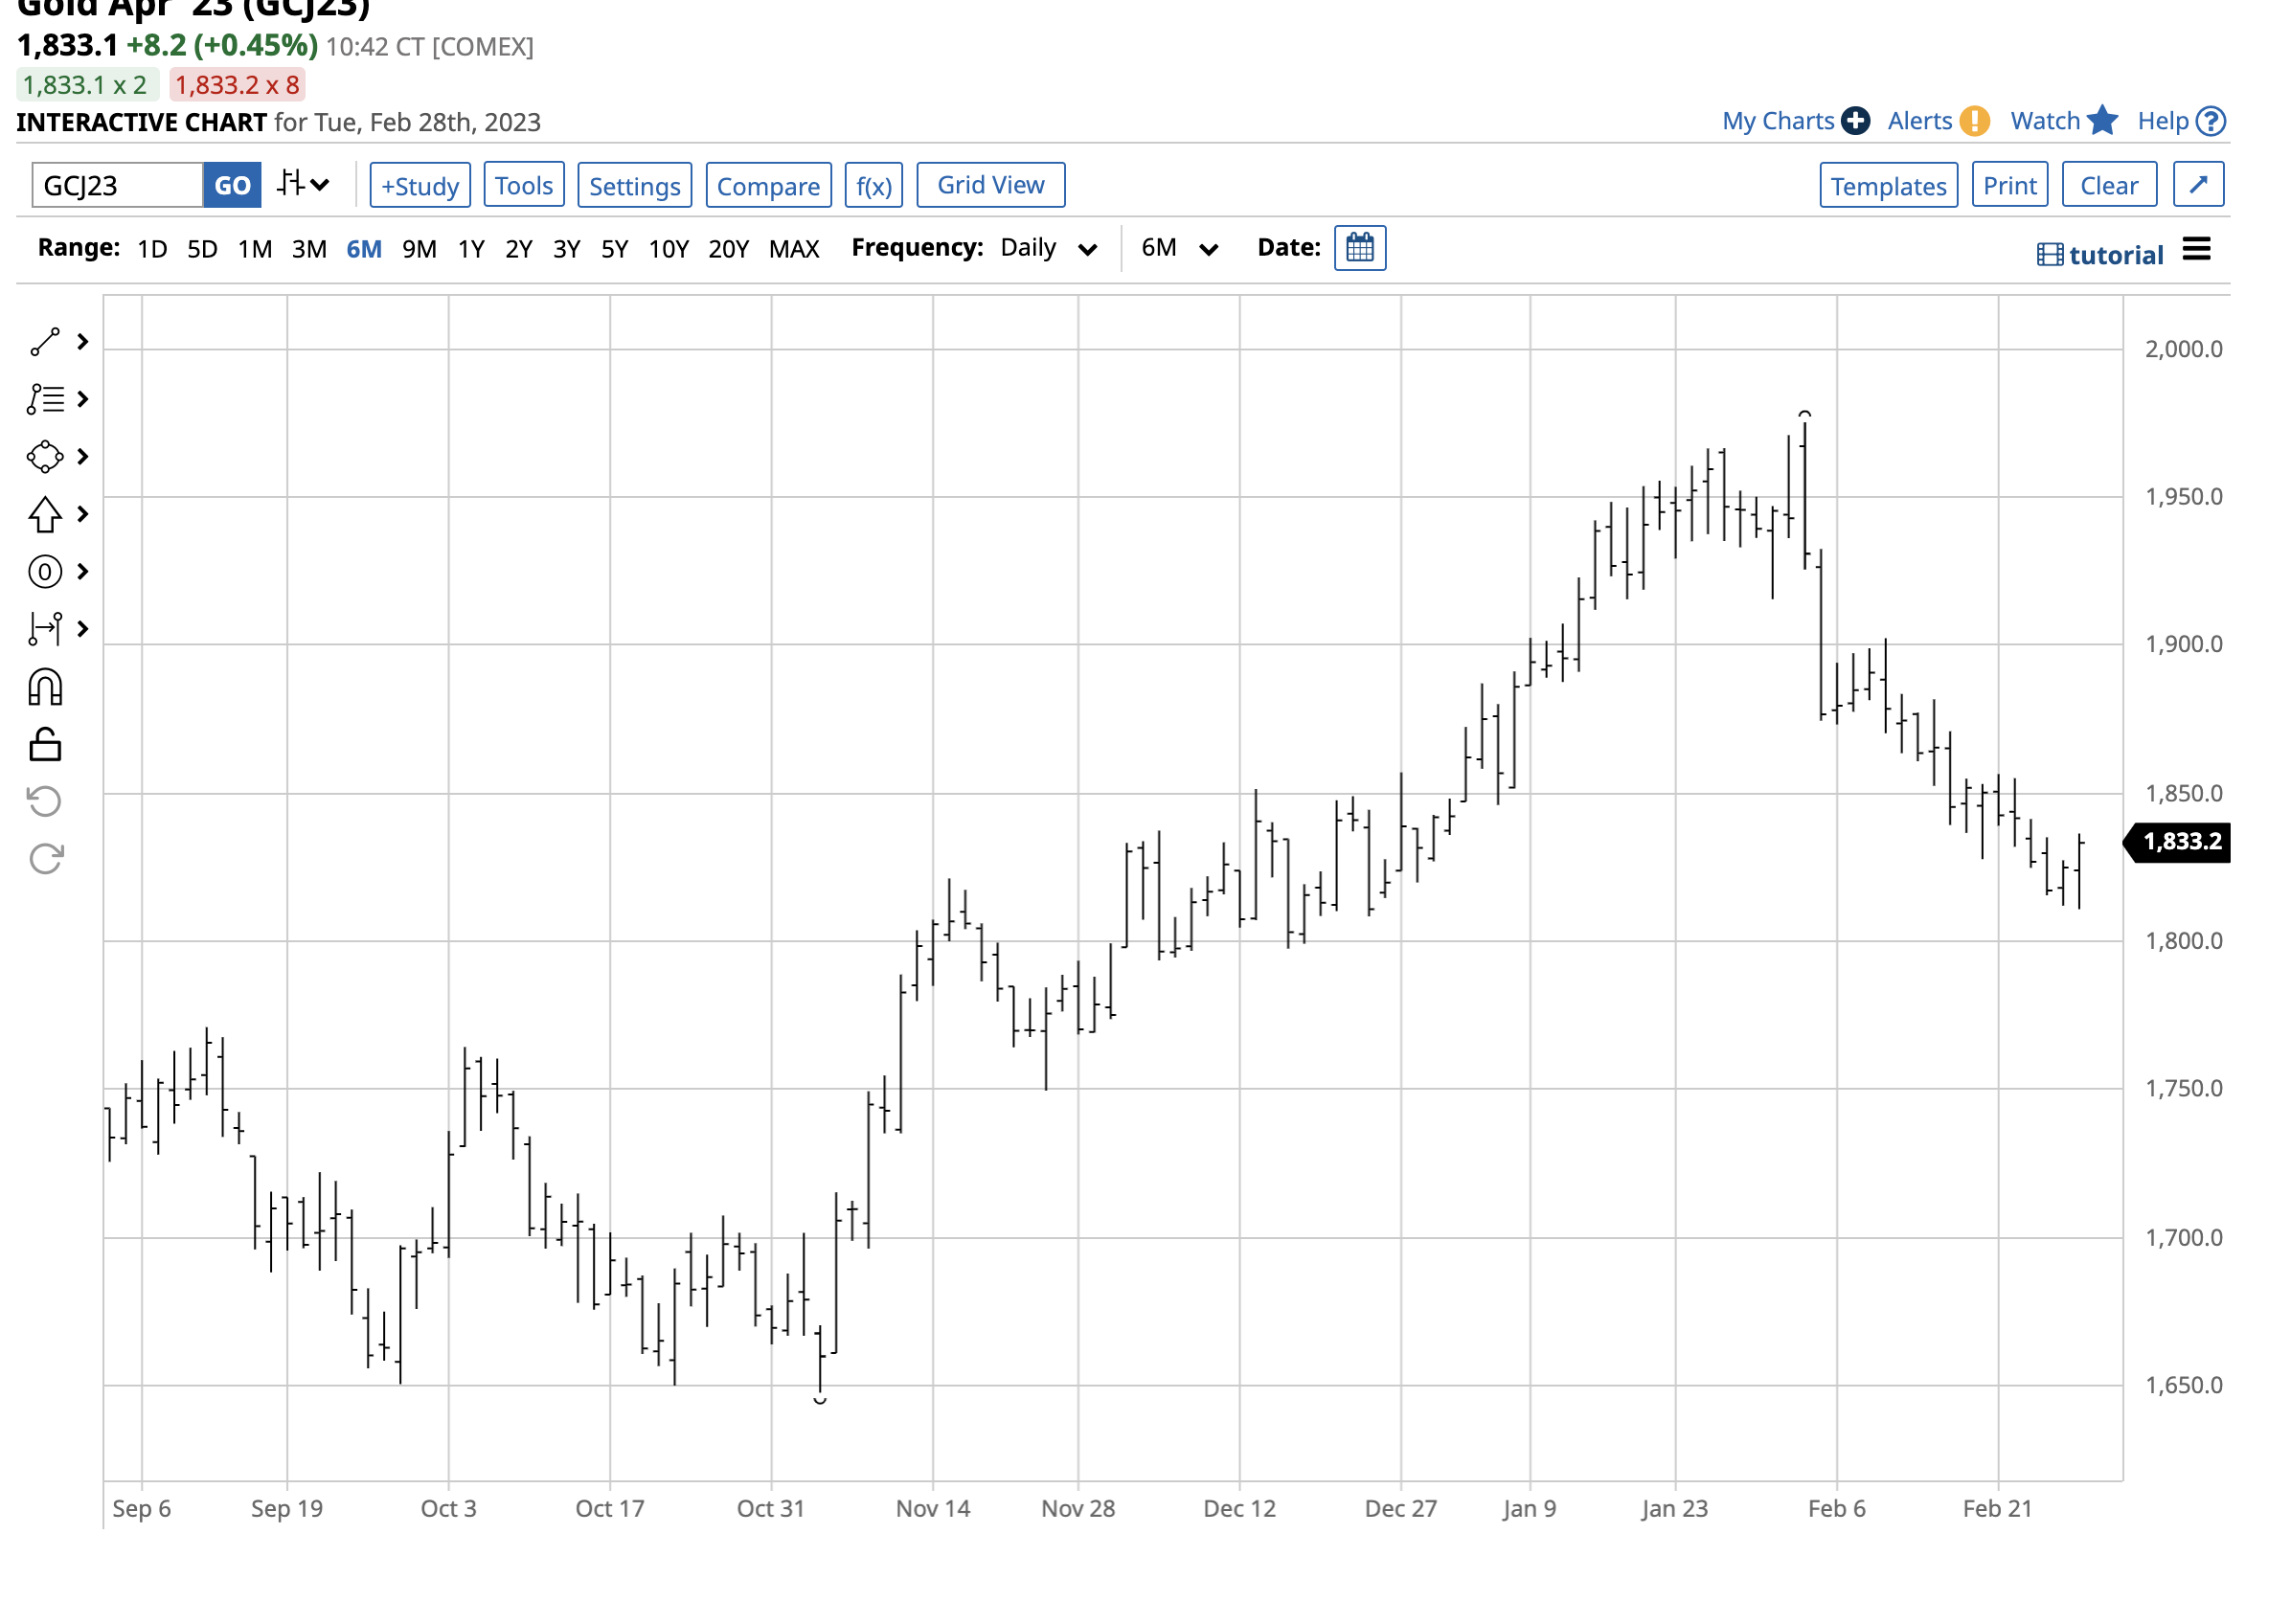
The short-term chart shows the rally from the November 3, 2022, $1,647.70 low to the February 2, 2023, $1975.20 high. Over the past weeks, gold made lower highs and lower lows, falling to $1,810.80 and trading near the low on February 28. The midpoint of the trading range is $1,811.45, and critical technical support sits at the November 3 low.
Rising interest rates have weighed on gold
Since gold is highly sensitive to interest rates, the Fed’s hawkish monetary stance has pushed the precious metal lower. The central bank moved short-term rates from 0.125% in March 2022 to a midpoint of 4.375% at the end of last year. The Fed only increased the short-term rate by 25 basis points at the early February meeting. Still, the most recent January CPI, PCE, and PPI reports showed an uptick in inflationary pressures, supporting a continuation of rate hikes. Moreover, the market consensus had been that the Fed would slow the trajectory of rate hikes as inflation had been falling over the past months, leading to the gold rally. The realization that the Fed will continue tightening credit to push inflation to its 2% target rate caused gold to run out of upside steam.

The March 30-Year Treasury bond futures chart highlights the decline in bond prices and the higher interest rates that stopped gold’s upward trajectory in early February.
The bounce in the U.S. dollar index has not been bullish
Since interest rate differentials are a critical factor for the path of the U.S. dollar, the U.S. currency bounced from its February 2, 2023, 101.680 low. The index measures the U.S. dollar against a basket of other reserve currencies, with a significant 57.6% weighting against the euro.
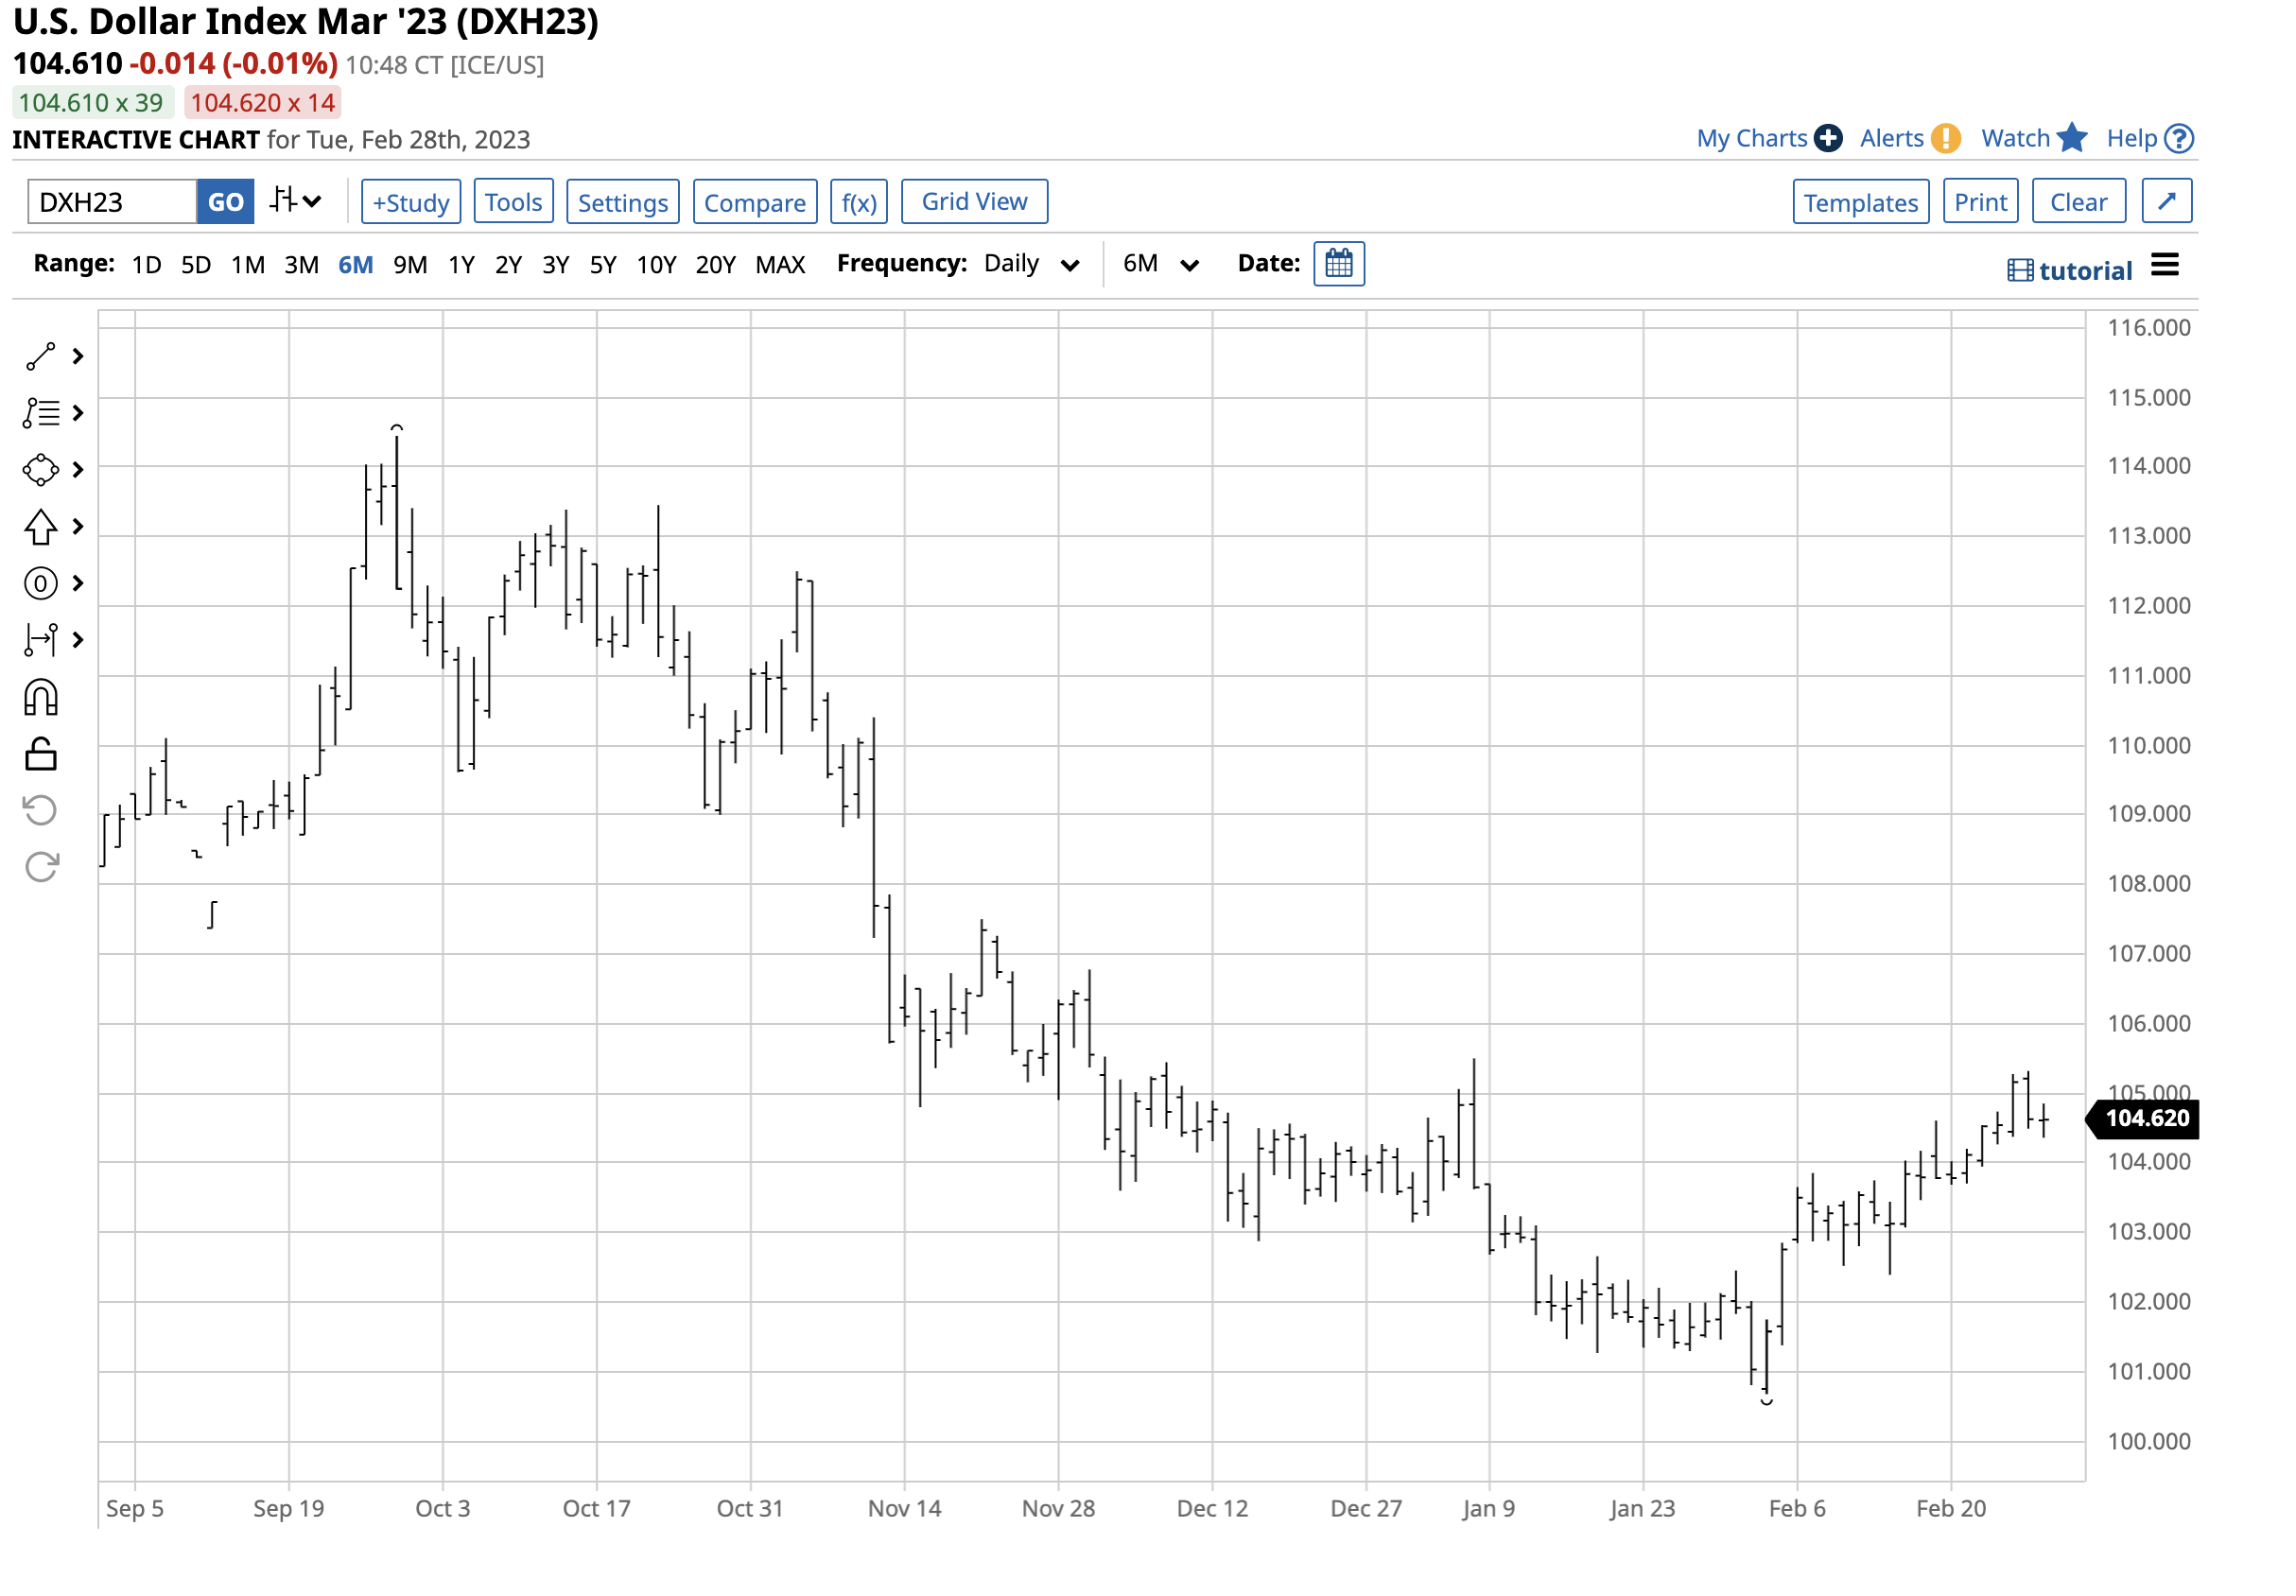
The March U.S. dollar index chart illustrates the bounce in the index that took it above the 104 technical resistance level to over 104.60 on February 28. A strong dollar tends to be bearish for gold because it causes the precious metal to move higher in other currencies. Higher gold prices in euros, yen, pounds, and other worldwide currencies often cause the demand to decline, causing dollar-based gold prices to move to the downside.
Geopolitics remains very bullish
While rising interest rates and a strong dollar are bearish for gold, the geopolitical landscape remains very supportive of the yellow metal. The ongoing and escalating war in Ukraine, the bifurcation between the world’s nuclear powers, and worldwide inflation are not bearish. Moreover, the decline of the U.S. dollar as the world’s reserve currency, with China, Russia, and their allies seeking to conduct cross-border trade with non-dollar assets, diminishes the dollar’s role in the global financial system. In 2022, as the U.S. and Europe imposed harsh sanctions, Russia declared 5,000 rubles were exchangeable for one gram of gold. China and Russia had been significant gold buyers over the past years, adding to reserves. Both countries have vacuumed up domestic production and purchased gold on the international market. While secretive about the levels of their total gold holdings, China and Russia have been stockpiling the metal and could use gold to back their currencies or to conduct trade.
The bottom line is the rising tensions worldwide are bullish for gold.
The long-term bullish trend remains intact
Gold’s short-term trend turned bearish on February 2, but the long-term path of least resistance remains bullish. Gold is a hybrid as the metal is a commodity and a foreign exchange asset. Central banks classify gold as a foreign currency reserve, validating its role in the worldwide financial system.
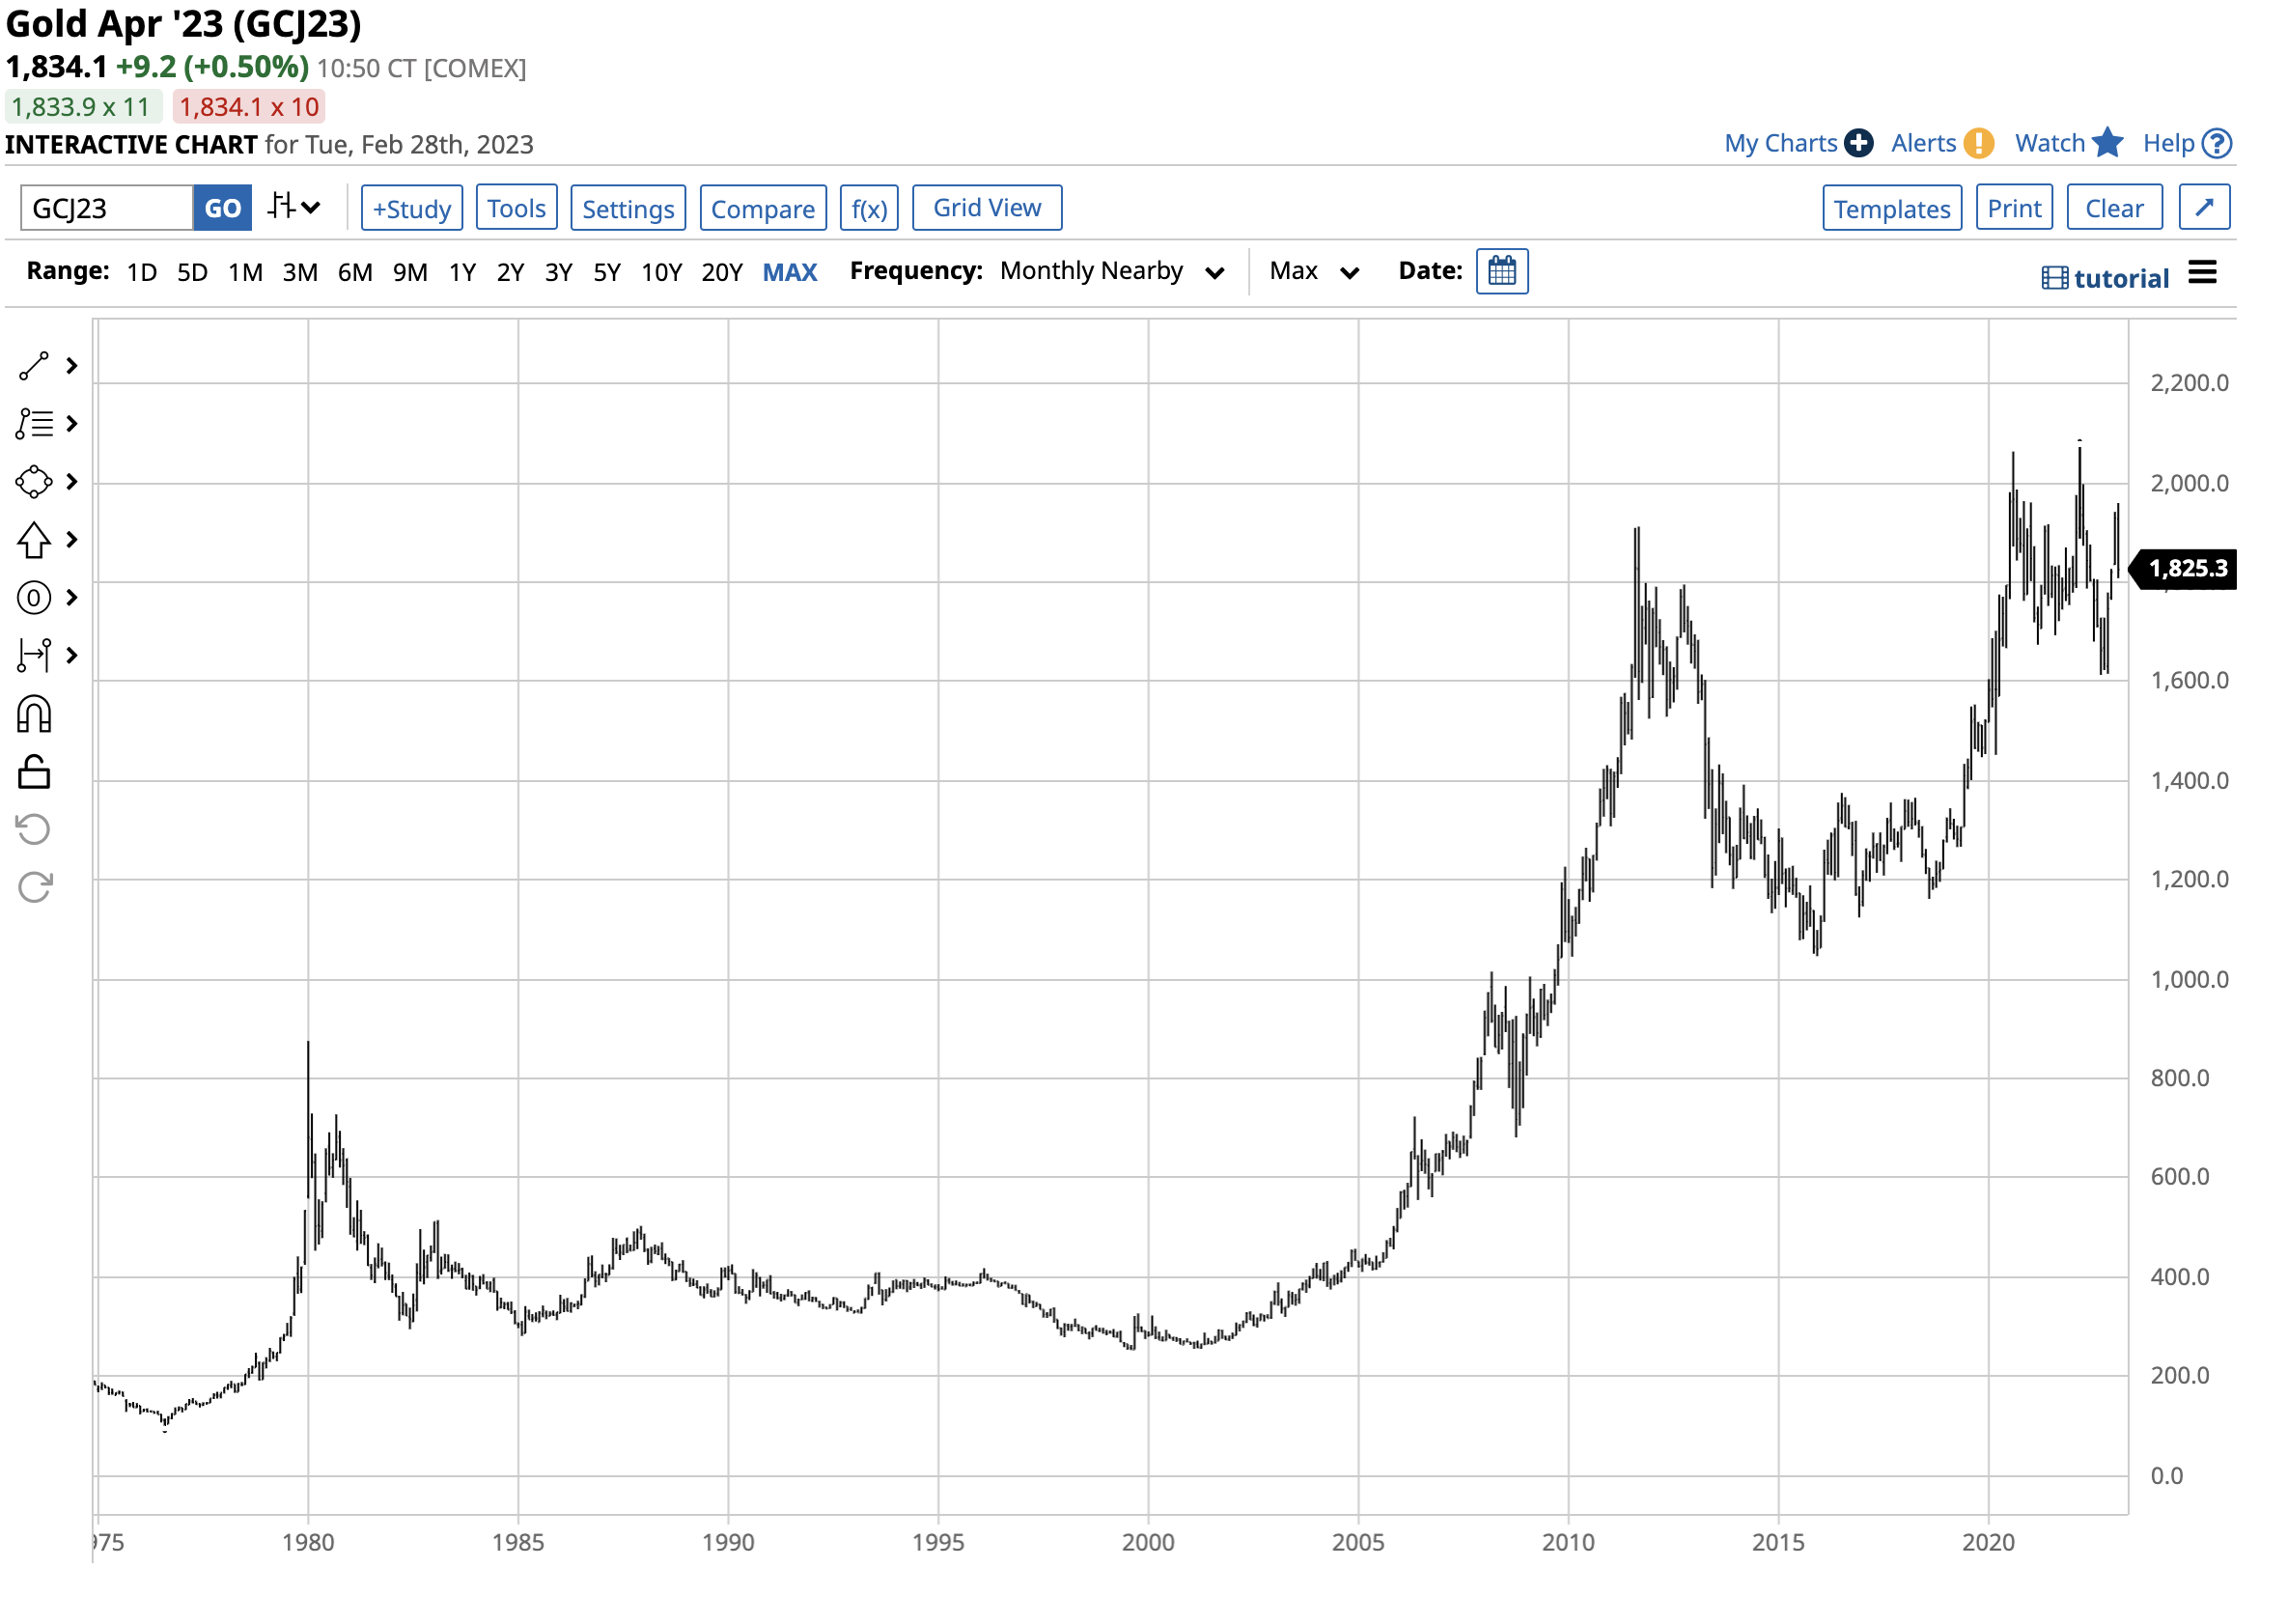
The chart dating back to the mid-1970s shows the bull market in gold started in 1999 at $252.50 per ounce, and from a long-term perspective, the precious metal continues to make higher lows and higher highs. Gold would need to fall below the December 2015 $1,046.20 low to negate the over two-decade bullish trend. Short-term support on the continuous contract is at the $1,613 low, but ending gold’s bull market would take a move that violates the long-term trend at near the $1,050 level.
Sine 1999, every correction in gold has been a buying opportunity, with the latest record high coming in March 2022 at $2,072 per ounce. Interest rates and the currency markets may not support gold in late February 2023. Still, the geopolitical landscape could be the most significant factor for the metal that is the world’s oldest means of exchange.
More Metals News from Barchart
- Stocks Mixed on Weak U.S. Economic News and Higher Global Bond Yields
- Dollar Slides Amid Lower Bond Yields and Stronger Stocks
- Stocks Climb on Increased M&A Activity and Lower Bond Yields
- The Dollar Index At A Critical Level
On the date of publication, Andrew Hecht did not have (either directly or indirectly) positions in any of the securities mentioned in this article. All information and data in this article is solely for informational purposes. For more information please view the Barchart Disclosure Policy here.
/Micron%20Technology%20Inc_%20logo%20on%20building-by%20vzphotos%20vis%20iStock.jpg)

/AI%20(artificial%20intelligence)/AI%20engineer%20working%20on%20laptop%20by%20ART%20STOCK%20CREATIVE%20via%20Shutterstock.jpg)

/A%20corporate%20office%20for%20IBM%20by%20HJBC%20via%20Adobe%20Stock.jpeg)