
Natural gas producer EQT (NYSE:EQT) reported Q1 CY2026 results topping the market’s revenue expectations, with sales up 57% year on year to $3.38 billion. Its non-GAAP profit of $2.33 per share was 7.9% above analysts’ consensus estimates.
Is now the time to buy EQT? Find out by accessing our full research report, it’s free.
EQT (EQT) Q1 CY2026 Highlights:
- Revenue: $3.38 billion vs analyst estimates of $3.19 billion (57% year-on-year growth, 5.9% beat)
- Adjusted EPS: $2.33 vs analyst estimates of $2.16 (7.9% beat)
- Adjusted EBITDA: $2.69 billion vs analyst estimates of $2.50 billion (79.6% margin, 7.7% beat)
- Operating Margin: 60.3%, up from 23.1% in the same quarter last year
- Free Cash Flow Margin: 72.7%, up from 57.7% in the same quarter last year
- Oil production: up 31.2% year on year
- Market Capitalization: $35.62 billion
President and CEO Toby Z. Rice stated, "EQT delivered outstanding operational and financial performance in the first quarter, generating record free cash flow while continuing to strengthen our balance sheet. These results demonstrate the power of our low-cost, integrated platform and highlight how our peer-leading breakeven positions us to thrive across commodity cycles."
Company Overview
The largest natural gas producer in the United States by daily volume, EQT (NYSE:EQT) produces natural gas and natural gas liquids from wells drilled in the Appalachian Basin.
Revenue Growth
Cyclical sectors like Energy often flatter weaker operators during favorable price environments, but a longer-term lens separates those from businesses that can consistently perform across market cycles. Over the last five years, EQT grew its sales at an excellent 19.1% compounded annual growth rate. Its growth surpassed the average energy upstream and integrated energy company and shows its offerings resonate with customers, a great starting point for our analysis.
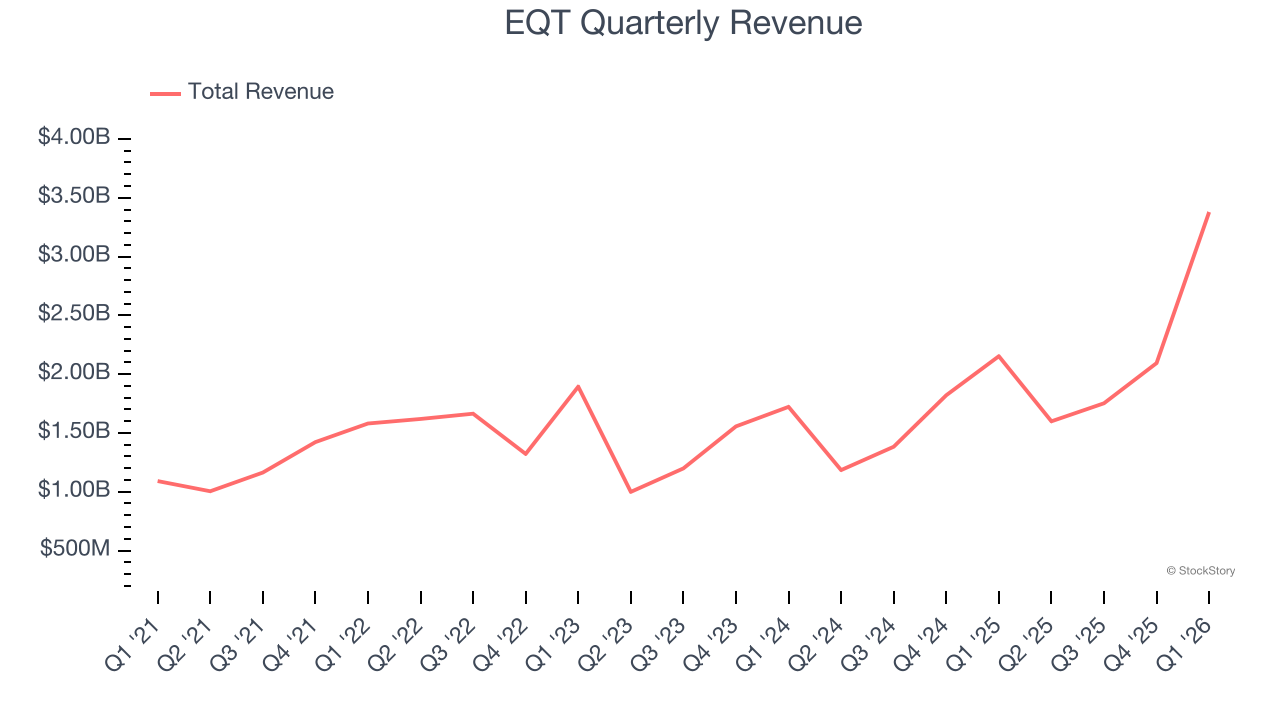
Even a long stretch in Energy can be shaped by a single commodity cycle, so extending the view to ten years adds another perspective and reveals which companies are built to grow regardless of the pricing regime. EQT’s annualized revenue growth of 15.7% over the last ten years is below its five-year trend, but we still think the results suggest decent demand.
Revenue provides useful context, but it is heavily influenced by commodity prices and acquisitions. Production volumes, by contrast, reveal whether the underlying asset base is actually growing. Over the last two years, EQT’s oil production averaged 7.5% year-on-year growth while its natural gas production averaged 7.7% year-on-year growth. 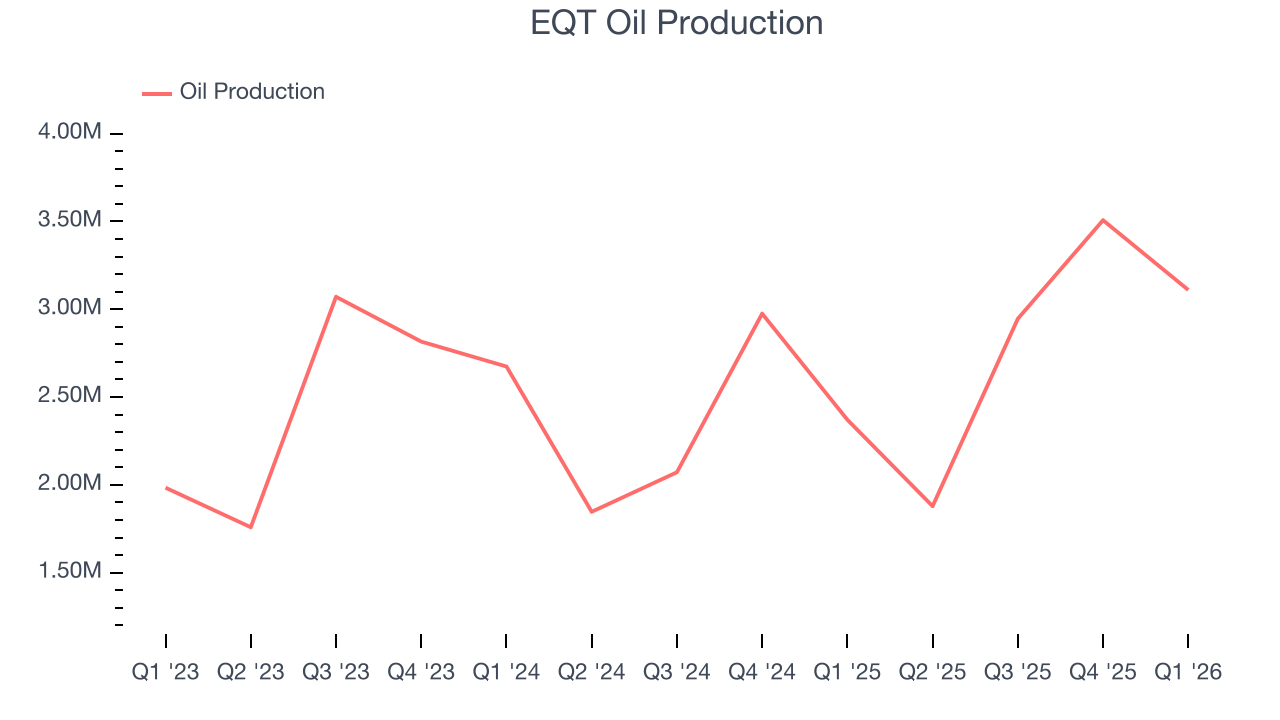
This quarter, EQT reported magnificent year-on-year revenue growth of 57%, and its $3.38 billion of revenue beat Wall Street’s estimates by 5.9%. This quarter, EQT reported wonderful year-on-year Oil production growth of 31.2%.
WHILE YOU’RE HERE: The Next Palantir? One satellite company captures images of every point on Earth. Every single day. The Pentagon wants it. Hedge funds are using it to beat earnings. You’ve probably never heard of it.
This is what the early days of Palantir looked like before it became a $437 billion giant. Same playbook. Different technology. If you missed Palantir, you need to see this. Claim The Stock Ticker for Free HERE.
Adjusted EBITDA Margin
Adjusted EBITDA margin strips out accounting distortions tied to depletion and historical drilling spend, providing a clearer view of the cash-generating power of the underlying asset base before financing and reinvestment decisions.
EQT has been a well-oiled machine over the last five years. It demonstrated elite profitability for an upstream and integrated energy business, boasting an average EBITDA margin of 62.2%.
Analyzing the trend in its profitability, EQT’s EBITDA margin rose by 20.6 percentage points over the last year, as its sales growth gave it immense operating leverage.
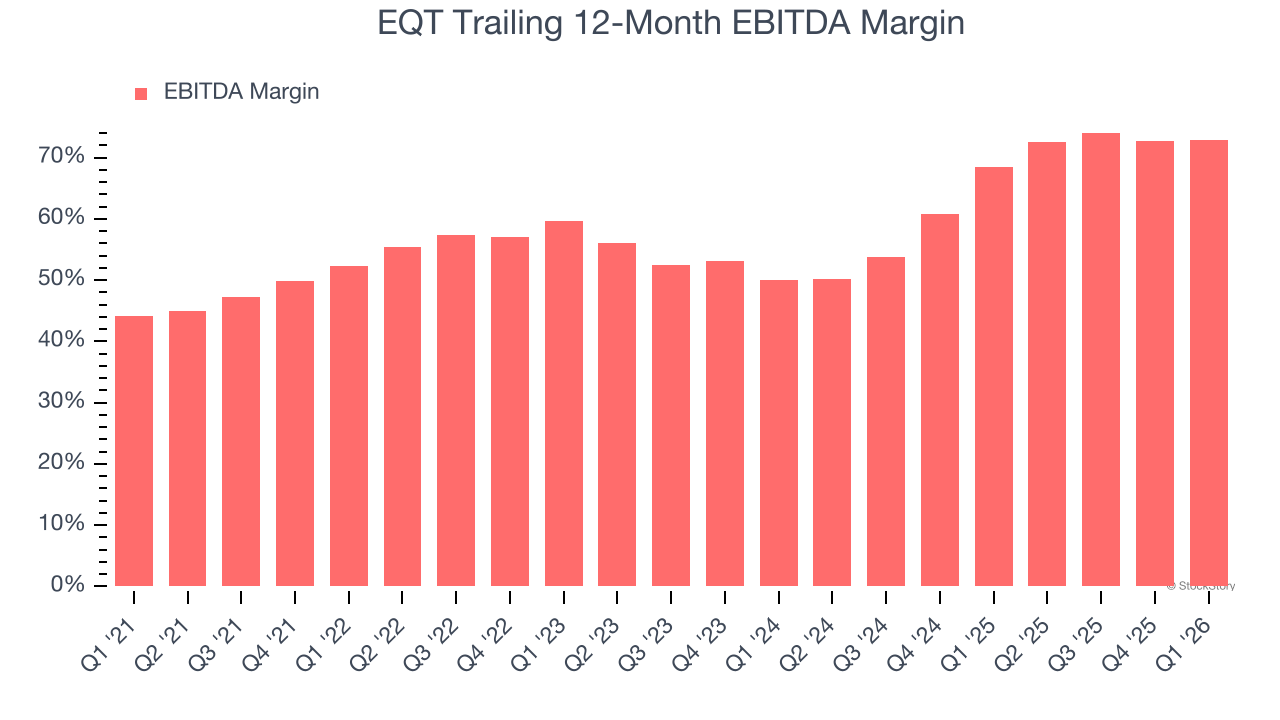
In Q1, EQT generated an EBITDA margin profit margin of 79.6%, down 3.1 percentage points year on year. This contraction shows it was less efficient because its expenses grew faster than its revenue. This adjusted EBITDA beat Wall Street’s estimates by 10.2%.
Cash Is King
As mentioned above, adjusted EBITDA ignores capital structure and drilling expenditure decisions. These are two huge aspects of an Energy producer, so in order to understand a comprehensive picture of business quality, an investor needs to account for these. Said differently, adjusted EBITDA margins could be solid but free cash flow is abysmal because decline rates of the asset are extreme and the drilling is expensive. Free cash flow tells you about not only the economics of the production that has happened but how much it costs to stay in business as well (further drilling or extraction).
EQT has shown terrific cash profitability, driven by its lucrative business model that enables it to reinvest, return capital to investors, and stay ahead of the competition. The company’s free cash flow margin was among the best in the energy upstream and integrated energy sector, averaging 29.4% over the last five years.
While the level of free cash flow margins is important, their consistency matters just as much.
EQT’s ratio of quarterly free cash flow volatility to Henry Hub gas-price volatility over the past five years was 3.2 (lower is better), indicating unusually strong insulation from commodity swings. This stability supports superior capital access in downturns and positions EQT to act as a consolidator when weaker peers are forced to retrench.
You may be asking why we wait until the free cash flow line to perform this stability analysis versus commodity prices. Why not compare revenue or EBITDA to Henry Hub Natural Gas prices in the case of EQT? Because what ultimately matters is not how much revenue or profit you earn when prices are high but how much cash you can generate when prices are low. Free cash flow is the superior metric because it includes everything from hedging prowess to growth and maintenance capex to management behavior during good times and bad.
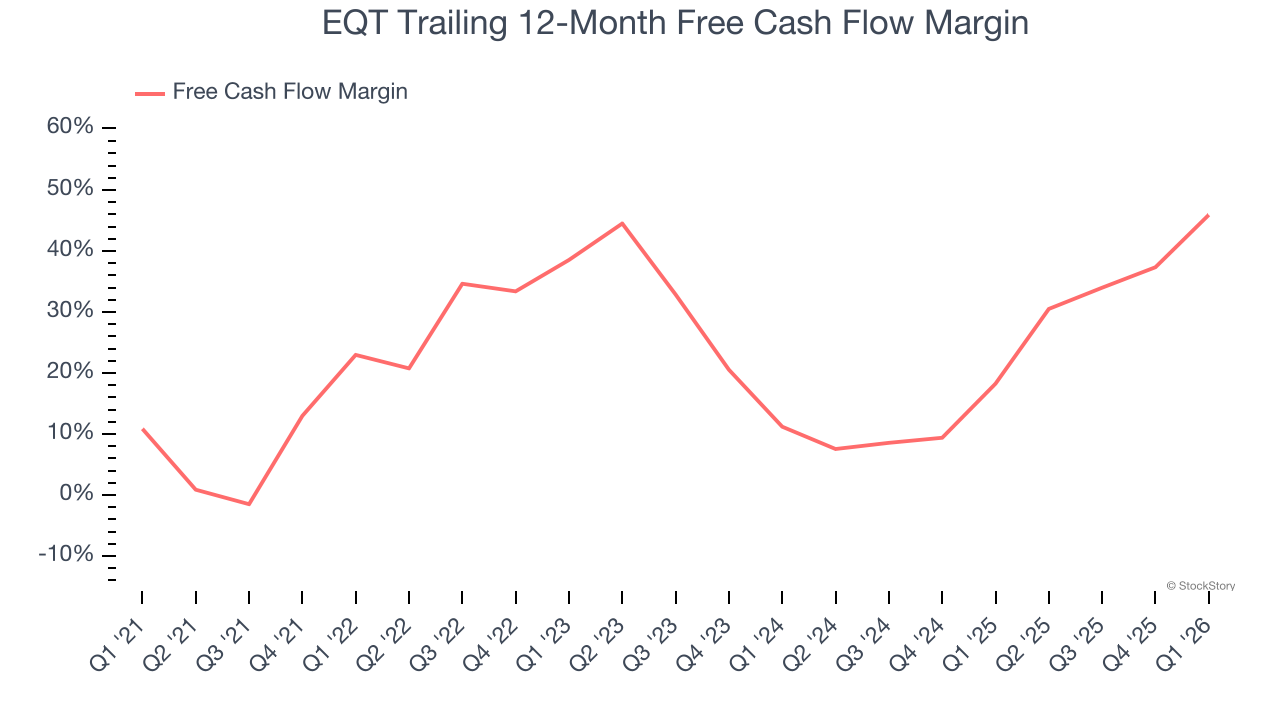
EQT’s free cash flow clocked in at $2.46 billion in Q1, equivalent to a 72.7% margin. This result was good as its margin was 15 percentage points higher than in the same quarter last year, building on its favorable historical trend.
Key Takeaways from EQT’s Q1 Results
We were impressed by how significantly EQT blew past analysts’ revenue expectations this quarter. We were also glad its EBITDA outperformed Wall Street’s estimates. Zooming out, we think this quarter featured some important positives. The stock remained flat at $56.86 immediately following the results.
Big picture, is EQT a buy here and now? If you’re making that decision, you should consider the bigger picture of valuation, business qualities, as well as the latest earnings. We cover that in our actionable full research report which you can read here (it’s free).

/Microsoft%20sign%20at%20the%20headquarters%20by%20VDB%20Photos%20via%20Shutterstock.jpg)


/Space/Cargo%20spacecraft%20in%20low-Earth%20orbit%20by%20Paopano%20via%20Shutterstock.jpg)