ETF Flows and Macro Repricing Drive Crypto’s Latest Leg Higher
The past month has been a study in how tightly Bitcoin is now tethered to macro and geopolitical developments. The dominant headline shaping sentiment has been the US-Iran conflict and the American blockade of the Strait of Hormuz, which kept oil prices elevated and injected persistent risk-off pressure across financial markets. Bitcoin, as the most liquid crypto asset, bore the brunt of the de-risking. However, when President Trump signaled openness to ceasefire with Iran and subsequently renewed talks with Tehran in April, the resulting relief across risk assets was immediate with Bitcoin breaking through the 74,000 resistance area that had capped price. This triggered approximately 534 million dollars in short liquidations across the broader crypto market.
On the institutional front, notable demand has underpinned the recovery. Strategy executed a 1 billion dollar purchase of 13,927 BTC in mid-April, bringing its total holdings to 780,897 BTC, while BlackRock's iShares Bitcoin Trust attracted 284 million dollars in a single day of inflows on April 17, with analysts at Nomura's Laser Digital citing both accumulation campaigns and ETF flows as primary drivers of the week's price action. Morgan Stanley also launched its own proprietary Bitcoin ETF in April, integrating it directly into its wealth management platform, a development that signals further mainstreaming of Bitcoin as a portfolio allocation tool.
The US Dollar Index (DXY) remains a key sensitivity point. The DXY has been weakening from early 2026 highs, and a softer dollar environment has historically served as a tailwind for Bitcoin. The broader tariff narrative, while less acute than during the peak of the US-China escalation in early 2025, remains a background variable: tariff-induced inflation concerns keep the Federal Reserve on hold, tightening financial conditions and acting as a structural headwind for risk assets broadly. Bitcoin is currently most sensitive to any geopolitical de-escalation catalyst, directional shifts in ETF flows, and any signal from the Fed regarding the rate path.
What the Market Has Done
- Since February, the market has been in a consolidation block between 74000, which is the daily level 3, and the 64000 area, which marks the midpoint of the multi month accumulation range. This structure reflects balance after the strong directional move seen earlier in the year.
- Since the start of April, buyers have stepped up bids on the back of easing geopolitical tensions surrounding the US-Iran ceasefire, a resumption of institutional ETF inflows, and continued corporate accumulation, lifting prices back towards the 74,000 area, which is confluent with the 2026 yearly VWAP. The yearly VWAP represents the volume weighted average price from the start of the calendar year and is widely used as a benchmark for institutional positioning and trend validation.
- Most recently, buyers were able to break above the 74000 level cleanly last Friday, April 18, signaling a potential shift from balance to expansion if acceptance above this level is sustained.
What to Expect in the Coming Weeks
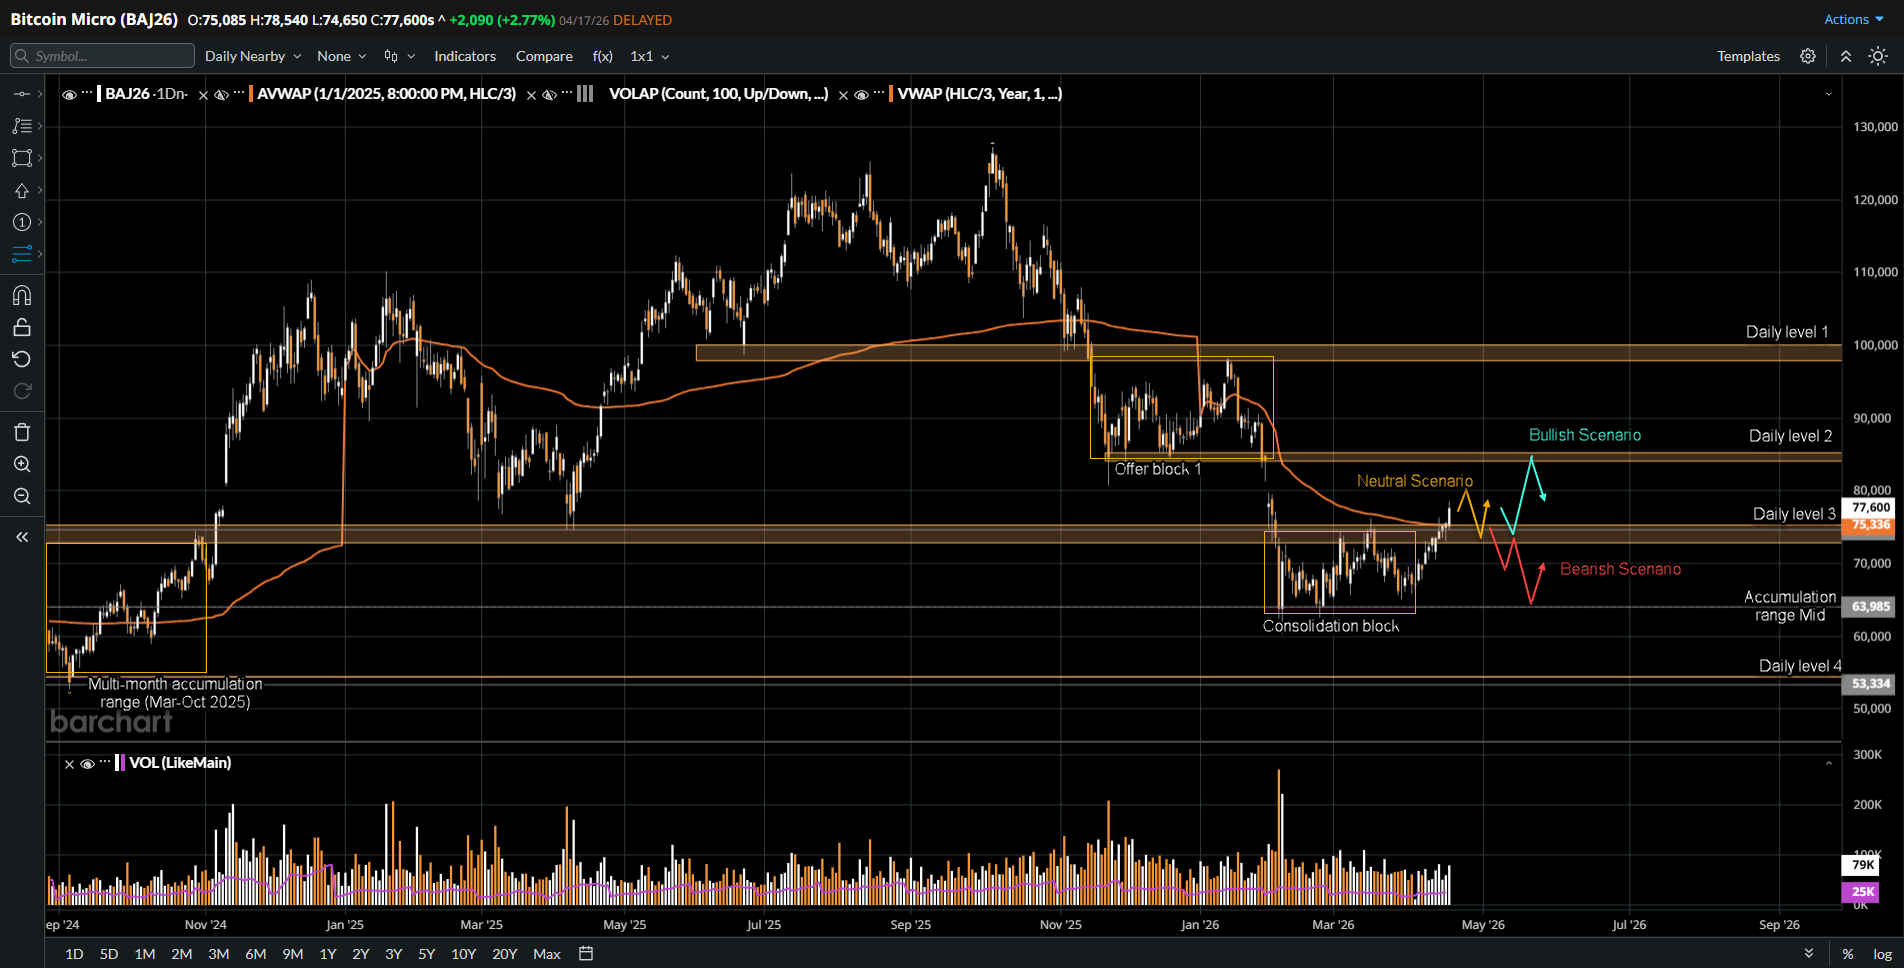
The key level to watch for is 74000 area (Daily level 3 / Consolidation block high).
Neutral Scenario
- A neutral outcome would involve a two-way rotation between the 74000 and 80000 area, which is the weekend gap from January 30 and February 2.
- This would suggest continued acceptance above the consolidation block but without immediate directional conviction.
- Possible Macro trigger: A continuation of the current ceasefire-adjacent ambiguity in the Middle East with no clear resolution, combined with a Federal Reserve that stays on hold and provides no new forward guidance, leaves markets in a holding pattern and Bitcoin drifting in a wide range.
Bullish Scenario
- If the market is able to hold above the 74000 area and/or the 2026 yearly VWAP, it would suggest continued acceptance above the prior consolidation block.
- In this case, expect a further move up towards the 80000 area, which is the weekend gap from January 30 and February 2.
- If sellers are not holding offers at that level, the market could close the gap and extend higher towards the 85000 area, which is the daily level 2 and the low of offer block 1.
- Possible Macro trigger: A credible ceasefire announcement in the Iran conflict, a formal de-escalation of the US-China tariff standoff, or a dovish signal from incoming Fed Chair Kevin Warsh would represent powerful catalysts. Any of these would drive a risk-on rotation at scale, pulling institutional capital back into the space and sustaining ETF inflows that underpin the bid.
Bearish Scenario
- If buyers fail to hold above 74000 and the market rotates back below this level, it would indicate a failed breakout and lack of acceptance.
- In that case, expect a move down towards the 64000 area, which is the midpoint of the multi month accumulation range, as longs positioned for the breakout begin to liquidate.
- Possible Macro trigger: A breakdown of ceasefire talks with Iran and a resumption of active conflict, a fresh escalation in tariffs that reignites global growth fears, or a hotter-than-expected inflation print that forces the Fed to signal rate hikes would all represent the type of risk-off shock that pushes leveraged longs to exit and sends price back through 74,000.
Conclusion
Bitcoin is at an inflection point that is equal parts technical and macro. The clean break above 74,000 and the 2026 yearly VWAP is a structurally significant development, removing price from a consolidation block that has defined trade since February. Institutionally, the backdrop is supportive with Strategy continuing to accumulate aggressively, BlackRock's IBITseeing meaningful single-day inflows, and Morgan Stanley's market entry broadening the demand base. On the macro side, the trajectory of the US-Iran situation and the pace of US-China trade normalization remain the dominant variables, with any meaningful de-escalation likely to serve as the catalyst that drives a sustained move toward 80,000 and beyond. The 74,000 level is where the story gets written.
For participants requiring precise and high-caliber market intelligence, our technical updates on Barchart provide the analytical foundation your trading business needs. Access top-tier data and professional-grade market commentary designed to optimize your execution on our futures trading platform and refine your methodology. Build your trading business on a professional foundation. Open an Account today.
Disclaimer:
This article is provided for informational and educational purposes only and does not constitute financial, investment, or trading advice. The analysis presented reflects the author’s market observations and opinions at the time of writing and is not a recommendation to buy or sell any futures contract, security, or financial instrument. Futures trading involves significant risk and is not suitable for all market participants. Losses may exceed initial margin deposits, and market conditions can change rapidly.
Any scenarios, levels, or market expectations discussed are hypothetical in nature and are intended solely to illustrate potential market behavior. They do not represent actual trading results and should not be interpreted as guarantees of future performance. Past performance, market behavior, or historical price action are not indicative of future outcomes.
Readers are solely responsible for their own trading decisions and risk management. Always conduct independent research, consider your financial situation and risk tolerance, and consult with a qualified financial professional, if necessary, before engaging in futures or derivatives trading.

/Microsoft%20sign%20at%20the%20headquarters%20by%20VDB%20Photos%20via%20Shutterstock.jpg)


/Space/Cargo%20spacecraft%20in%20low-Earth%20orbit%20by%20Paopano%20via%20Shutterstock.jpg)