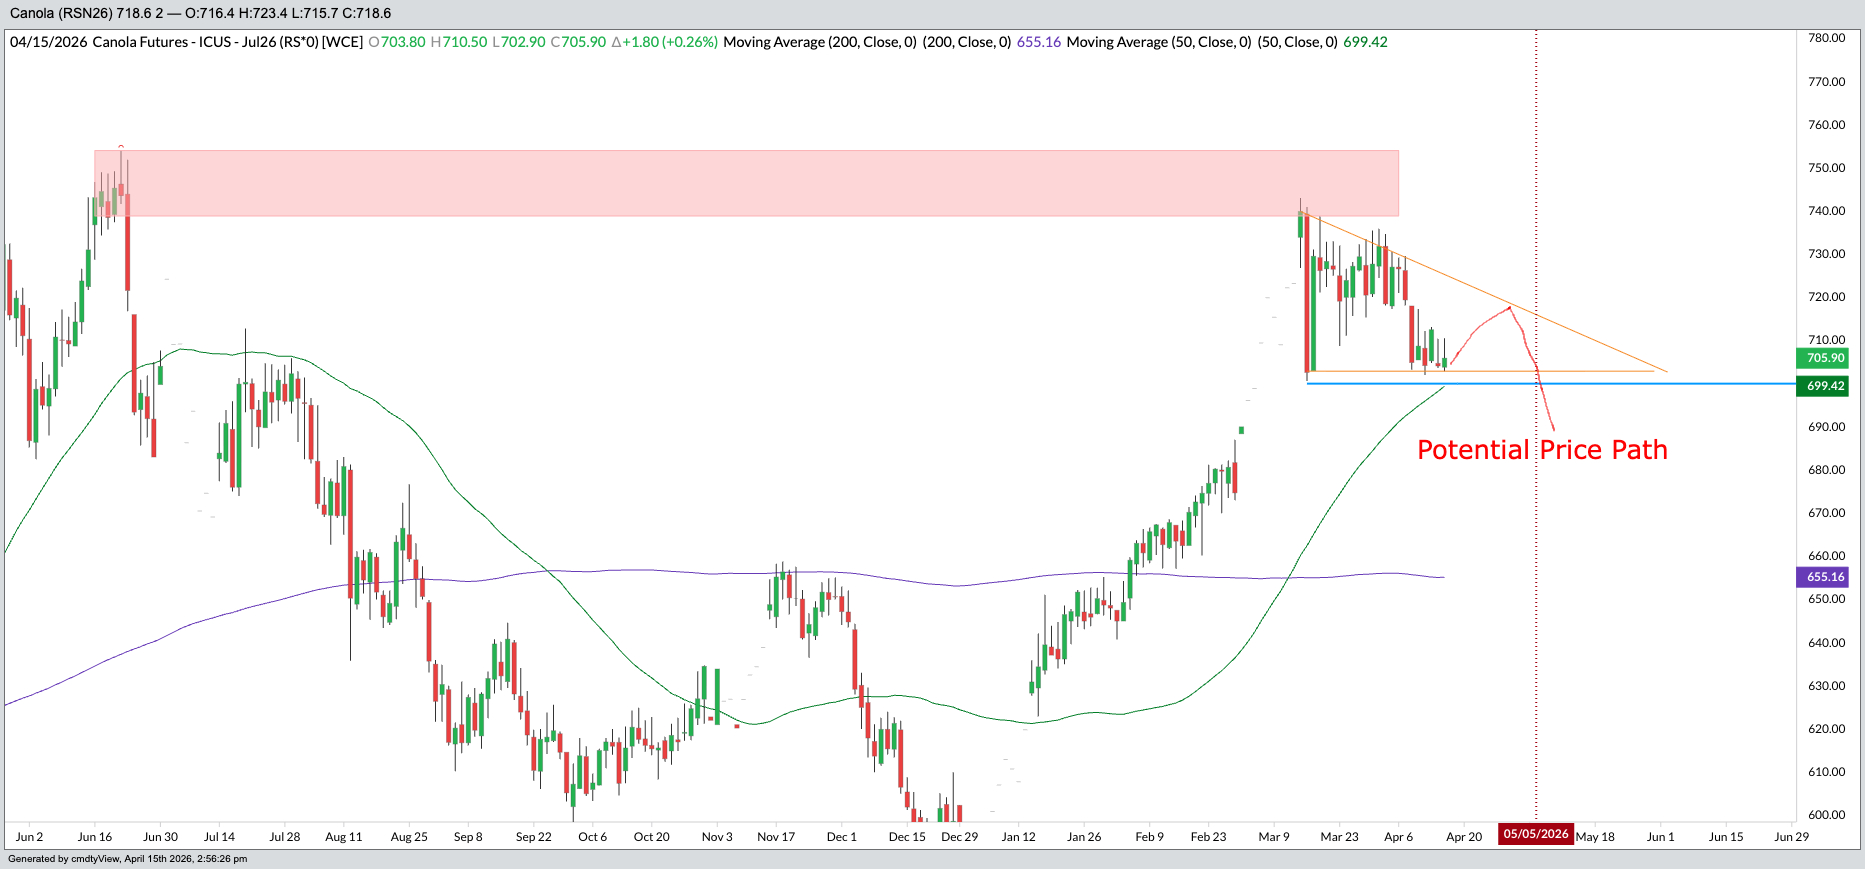
Canola Daily Nearby chart
The price is attempting to test the previous lows and the green 50- Day Moving Average.
The 50-DMA is still advancing and may begin to flatten out on or near May 5th.
The red line outlines a potential price path with the potential break below 700 on or near May 5th.
Will it happen?
I cover this technical setup and specific price targets in depth in the Klarenbach Grain Report.
Join 3,500+ farmers getting sell signals and technical roadmaps here:
Trent Klarenbach, BSA AgEc, PAg, publishes the Klarenbach Grain Report and the Klarenbach Special Crops Report.
Klarenbach Research
Sign up below for a FREE trial of our newsletters
/Micron%20Technology%20Inc_billboard-by%20Poetra_RH%20via%20Shutterstock.jpg)

/The%20CoreWeave%20logo%20displayed%20on%20a%20smartphone%20screen_%20Image%20by%20Robert%20Way%20via%20Shutterstock_.jpg)
/Elon%20Musk%2C%20founder%2C%20CEO%2C%20and%20chief%20engineer%20of%20SpaceX%2C%20CEO%20of%20Tesla%20by%20Frederic%20Legrand%20-%20COMEO%20via%20Shutterstock.jpg)