The Chart of the Day belongs to the Argentine energy company Pampa Energia (PAM). I found the stock by using Barchart's powerful screening functions to find stocks with the highest technical buy signals, highest Weighted Alpha, superior current momentum and having a Trend Seeker buy signal then used the Flipchart feature to review the charts for consistent price appreciation. Since the Trend Seeker signaled a buy on 11/19 the stock gained 14.76%.
Pampa Energía S.A., an integrated power company, engages in the generation and transmission of electricity in Argentina. The company operates through Electricity Generation, Oil and Gas, Petrochemicals, and Holding and Other Business segments. It generates electricity through combined thermal generation plants, open-cycle gas turbines, and hydroelectric power generation systems, as well as through a wind farm. The company has an installed electricity generation capacity of approximately 4,970 megawatts; and 21,414 kilometers of high voltage electricity transmission network in Argentina. It is also involved in the exploration and production of oil and gas. In addition, the company offers petrochemicals, such as styrene, synthetic rubber, and polystyrene. As of December 31, 2020, it had approximately 12.625 thousands of barrels of oil and LNG, as well as 24.537 millions of cubic meters of natural gas; owned a refinery with an installed capacity of approximately 25.8 thousand barrels per day; and operated a network of 92 gas stations. The company was formerly known as Pampa Holding S.A. and changed its name to Pampa Energía S.A. in September 2008. Pampa Energía S.A. was incorporated in 1945 and is based in Buenos Aires, Argentina.
Barchart's Opinion Trading systems are listed below. Please note that the Barchart Opinion indicators are updated live during the session every 20 minutes and can therefore change during the day as the market fluctuates. The indicator numbers shown below therefore may not match what you see live on the Barchart.com website when you read this report.
Barchart Technical Indicators:
- 100% technical buy signals
- 74.10+Weighted Alpha
- 59.51% gain in the last year
- Trend Seeker buy signal
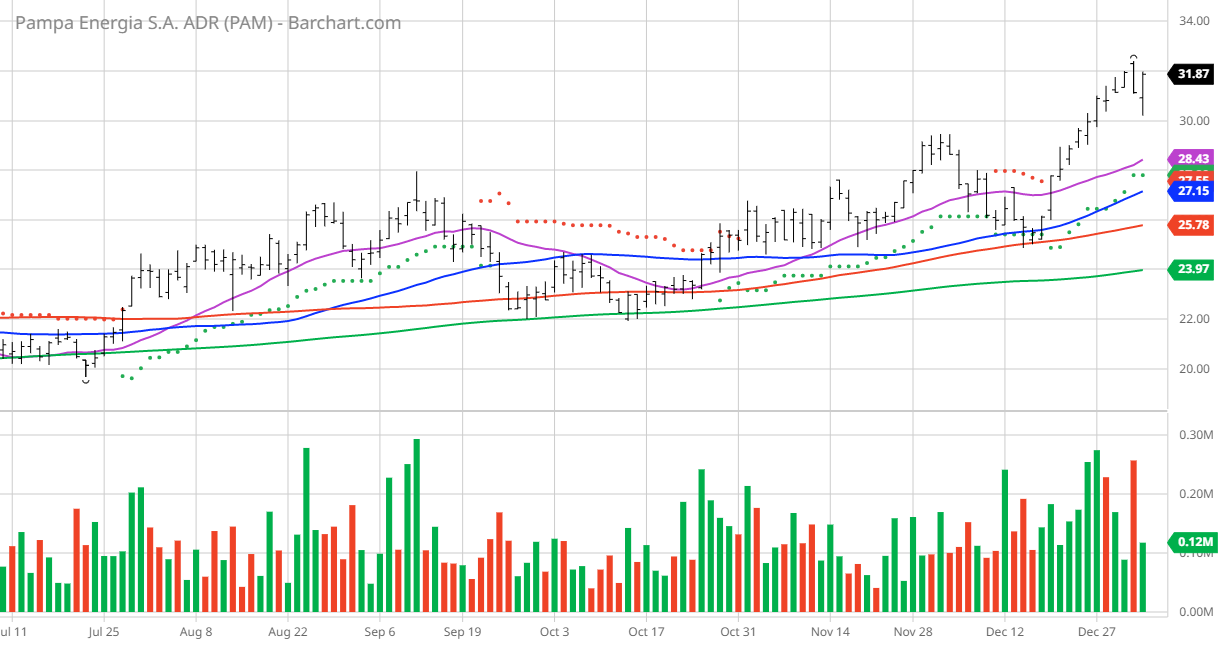
- Above its 20, 50 and 100 day moving averages
- 10 new highs and up 11.28% in the last month
- Relative Strength Index 69.92%
- Recently traded at $31.87 with 50 day moving average of $27.15
Fundamental Factors:
- Market Cap $1.72 billion
- P/E 4.62
- Revenue expected to increase 14.20% this year and another 18.00% next year
- Earnings estimated to increase 17.50% this year, an additional 1.50% next year and continue to compound again at an annual rate of 7.60% for the next 5 years
Analysts and Investor Sentiment -- I don't buy stocks because everyone else is buying but I do realize that if major firms and investors are dumping a stock it's hard to make money swimming against the tide:
- Wall Street analysts have 1 strong buy, 2 buy , 5 hold and 1 sell opinions in place on this stock
- Analysts have price targets from $19.50 to $ 48.20 with an average of $ 28.62 which is down 10.23% from its close today of $ 31.87
- The individual investors following the stock on Motley Fool voted 18 to 5 for the stock to beat the market with more experienced investors voting 2 to 4 for a different result
- 3,660 investors are monitoring this stock on Seeking Alpha
Disclosure: I/we have no stock, option or similar derivative position in any of the companies mentioned, but may initiate a beneficial Long position through a purchase of the stock, or the purchase of call options or similar derivatives in {AM over the next 72 hours.
Additional disclosure: The Barchart Chart of the Day highlights stocks that are experiencing exceptional current price appreciation. They are not intended to be buy recommendations as these stocks are extremely volatile and speculative. Should you decide to add one of these stocks to your investment portfolio it is highly suggested you follow a predetermined diversification and moving stop loss discipline that is consistent with your personal investment risk tolerance and reevaluate your stop losses at least on a weekly basis.
On the date of publication, Jim Van Meerten did not have (either directly or indirectly) positions in any of the securities mentioned in this article. All information and data in this article is solely for informational purposes.


/A%20Palantir%20sign%20displayed%20on%20an%20office%20building%20by%20Poetra_RH%20via%20Shutterstock.jpg)
