
The monthly corn chart illustrates the commodity's all-time highs and the most recent rally highs.
Price catalyst
Like most commodities, the corn market has experienced an explosive bull market since 2020. The recent highs fell short of new all-time highs made in 2012, during the worst drought in 50 years.
Several factors are contributing to these high prices:
- The weather has not only caused crop production issues but has lowered the water levels of the Mississippi River to the point where barges cannot get the grains to the Gulf of Mexico for export purposes.
- Supply chain issues are causing problems with rail transportation and the shipping labor market.
- The war in Ukraine, 3rd largest producer of world corn, has reduced the supply of corn to feed the world.
- US farmers are content not selling corn when the market is begging for grains. The USDA reports a tight carryout for next year, leading producers to believe higher prices are yet to come.
- As we get closer to the end of December, Argentina's crops will have been planted, and the third year of La Nina is expected to reduce crop yields.
- Looking forward, there have been some estimates that Ukraine could decrease production by 25% while Europe is coming off a severe drought, reducing their production. If La Nina reduces the South American, 2nd largest corn producer, crop, the US, the world's largest producer of corn, would be the major player that would have to supply world corn.
Source: Moore Research Center, Inc. (MRCI)
During the previous two years, farmers have received above-average crop prices. There is little incentive to bring crops to the market in the near term. With the above factors contributing to higher corn prices and a possible seasonal post-harvest price rally, farmers have extra cash and time.
Style of trading the market
There are multiple ways for a trader to participate in this bull market:
- A standard-size corn futures contract (ZC)
- The mini-size futures contract (XC)
- Exchange Traded Fund (CORN)
- Options on futures contracts or the ETF
- Intra-commodity futures spread
Depending on which way you choose to trade corn, measuring your risk to your reward should be an essential determinant in choosing your method. Plus, the technique must fit your personality, risk comfort, and understanding of the market behavior.
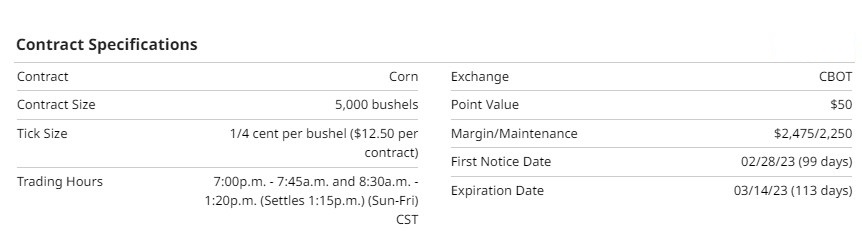
The standard-size corn contract size is 5,000 bushels. Each .01 move is worth $50. As the corn bull market has continued, the average daily price range has also increased. Daily at about .15 per bushel, the market moves about $750 per day in dollar terms.
During the 18-hour trading session, news or weather reports can move the market rapidly in either direction and exceed the average daily range. Excessive volatility like this has the potential to stop out a good trade.
Spreading reduces volatility and risk, therefore lowering margin requirements. While the outright positions move $750 per day and would require $2,250 of margin per contract, a corn spread, I'll show you moves about $250 per day and would need $850 of margin per spread (one spread is one long contract and one short contract.) An added cost of spread trading is that you will pay two commissions per spread since there are two futures contracts.
Remember that spreads can reduce but don't eliminate the risk. One way to mitigate this volatility is to use intra-commodity spreads. Reducing volatility also reduces capital requirements to trade the product and increases the staying power of trades.
In a previous article for Barchart, I described the basics of spread trading and some terminology used.
MRCI is a company that produces seasonal pattern research on spreads (simultaneously long and short, the same market, but different expiration months) and outrights (either long or short.) Screening for markets with potential seasonal patterns and then applying my analysis to determine if I want to take that trade can give me an added edge.
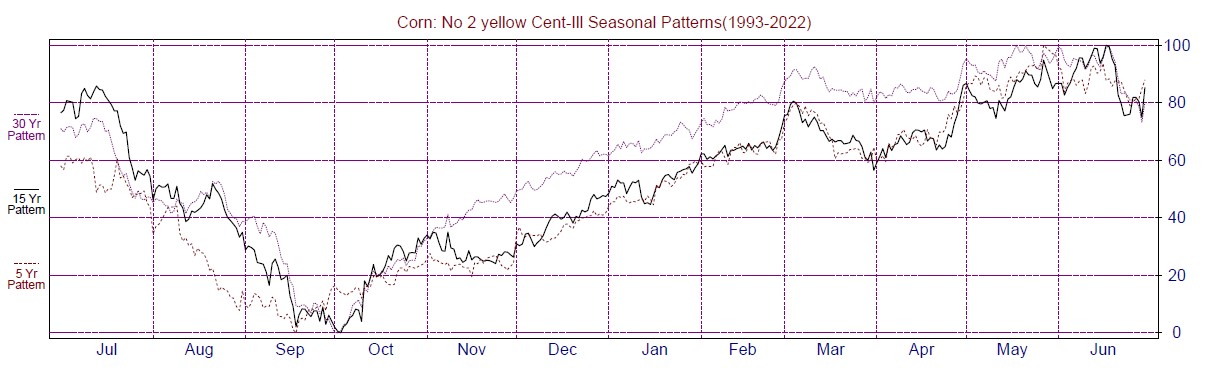
The bulk of the US corn crop is planted in April/May and harvested mid-September through mid-November (87% as of 11/6/22). Thus, the USDA crop marketing year runs September-August, although the December futures contract best represents the new crop.
Referring to the seasonal cash corn chart above, one can see that corn makes its seasonal bottom in early October as harvest gets underway in earnest and supplies flood the market. But then exporters and domestic consumers readily come to the market to take advantage of typical harvest lows. Producers sell some grain but often want to store as much as possible, both to wait for market recovery and the new tax year. This demand for physical supply has tended to generate a post-harvest recovery rally.
Bull spreads are fueled by solid demand as market participants demand corn sooner rather than later. With most of the corn harvest over for 2022, the market is less concerned with the potential new crop for next year. Even in years with lesser demand, prices for the current harvested crop tend to improve more during the post-harvest recovery than for the crop to be harvested a year away.
MRCI has found the Long March/Short Red December Corn futures spread closed more favorably toward March on about January 30 than on about November 17 for the last 12 consecutive years and 14 of the previous 15 --- in only 2 of which suffered a daily closing drawdown greater than 9.00 cents/bushel. (Each 1.00 cent/bushel is worth $50.) A spread designated as Red has one leg of the spread expiring one year from the same but more current month. Thus, the strategy for this year would be long March 2023 and short December 2023.
This year's 2023 spread traded up to 113.50 in mid-May only to trade down to as low as 25.00 in mid-May. It then rose again to as high as 73.00 on November 1. Since then, it has declined again to test the 40-60% retracement zone at 44.00 – 54.00.
Will that generate enough support to reinforce seasonal fundamentals and increase the spread? The seasonal pattern suggests the spread most typically makes its bottom in the first days of October, recovers modestly, then makes a slightly higher low in mid-November. When the trading environment is bullish for the spread, it begins a gentle uptrend into the new year.
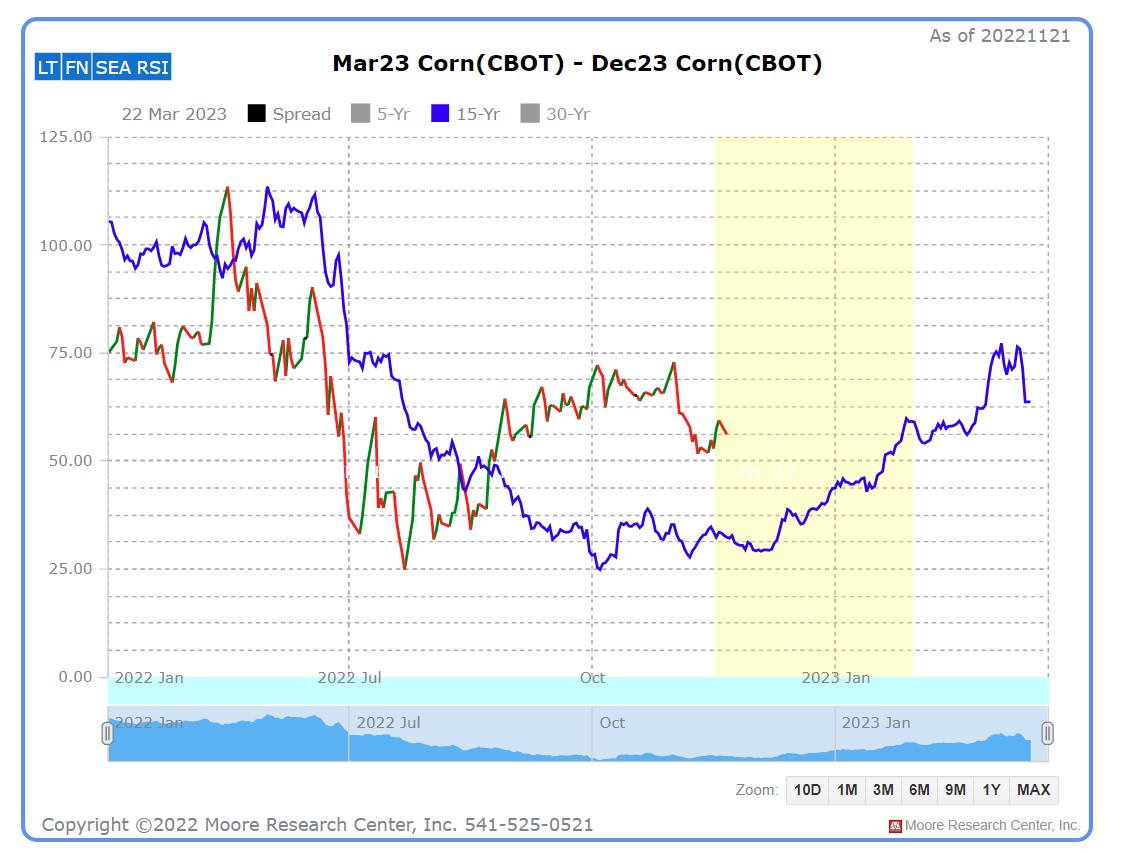
Source: MRCI Daily Chart of Spread
The blue line represents the 15-year average price pattern. The red/green line represents the current price for the spread. The yellow box represents the optimal time of the year for the seasonal spread to move. Try to avoid getting too obsessed with these exact dates. Sometimes the patterns are a little early or later each year.
Technical analysis of a spread
As price comes into these seasonal windows, it is highly recommended that you apply your technical analysis skills to determine if the trade will work and to manage your risk and reward.
This seasonal spread is structured to be bought, so buying while the spread is in a downtrend may not suit your trading style. If you follow trends, you can see that the shorter-term trend is down. Waiting for the trend to turn up would put this trade more in your favor instead of attempting to pick a bottom where you "think" the market might stop going down.
Using price action to enter the trade might be locating the recent swing high (left of the yellow box) and patiently waiting for a daily close above this pivot high. At that point, the price will have a higher high and a higher low to help confirm an uptrend during a seasonal buy.
Using indicators such as the relative strength index (RSI) might alert you to where the spread price is oversold during the seasonal window and may offer a timing aid to entering the trade.
Technical analysis of spreads can be very similar to outright longs and shorts. Depending on the type of chart one uses. The above seasonal chart is a line-on-close (LOC) chart, but some charting software packages will create candlestick charts to perform traditional technical analysis.
MRCI has found that seasonal patterns that bottom early tend to have more decisive moves due to the higher demand that created the early low. This spread typically puts a seasonal low in October. This year the low appears to have been put in during July.
More Grain News from Barchart
- Cocoa Prices Under Pressure on Global Demand Concerns
- Sugar Prices Mixed on Possible Delay of Thailand's Sugar Cane Crush
- Coffee Moderately Higher on Lower Colombian Coffee Production
- Modestly Lower Prices in Corn Market

/Renewable%20Energy%20by%20Yuri%20Hoya%20via%20Shutterstock.jpg)


/Micron%20Technology%20Inc_%20logo%20on%20building-by%20vzphotos%20vis%20iStock.jpg)