
- Since Tuesday, November 8 USDA has announced 2022-2023 marketing year corn sales of 2,018,976 mt (79.5 mb).
- This came as a surprise to some, given December corn has fallen from near $7.00 to roughly $6.50 during November (so far).
- However, our three key fundamental reads of cash price, basis, and futures spreads have all been telling us demand continues to increase for tight supplies.
I’ve been talking with a good friend in the brokerage community of late, with the subject being the oddity of King Corn’s behavior. I’m not talking Hamlet style crazy, but rather the December issue not acting as one would expect given the market narrative. To quickly recap:
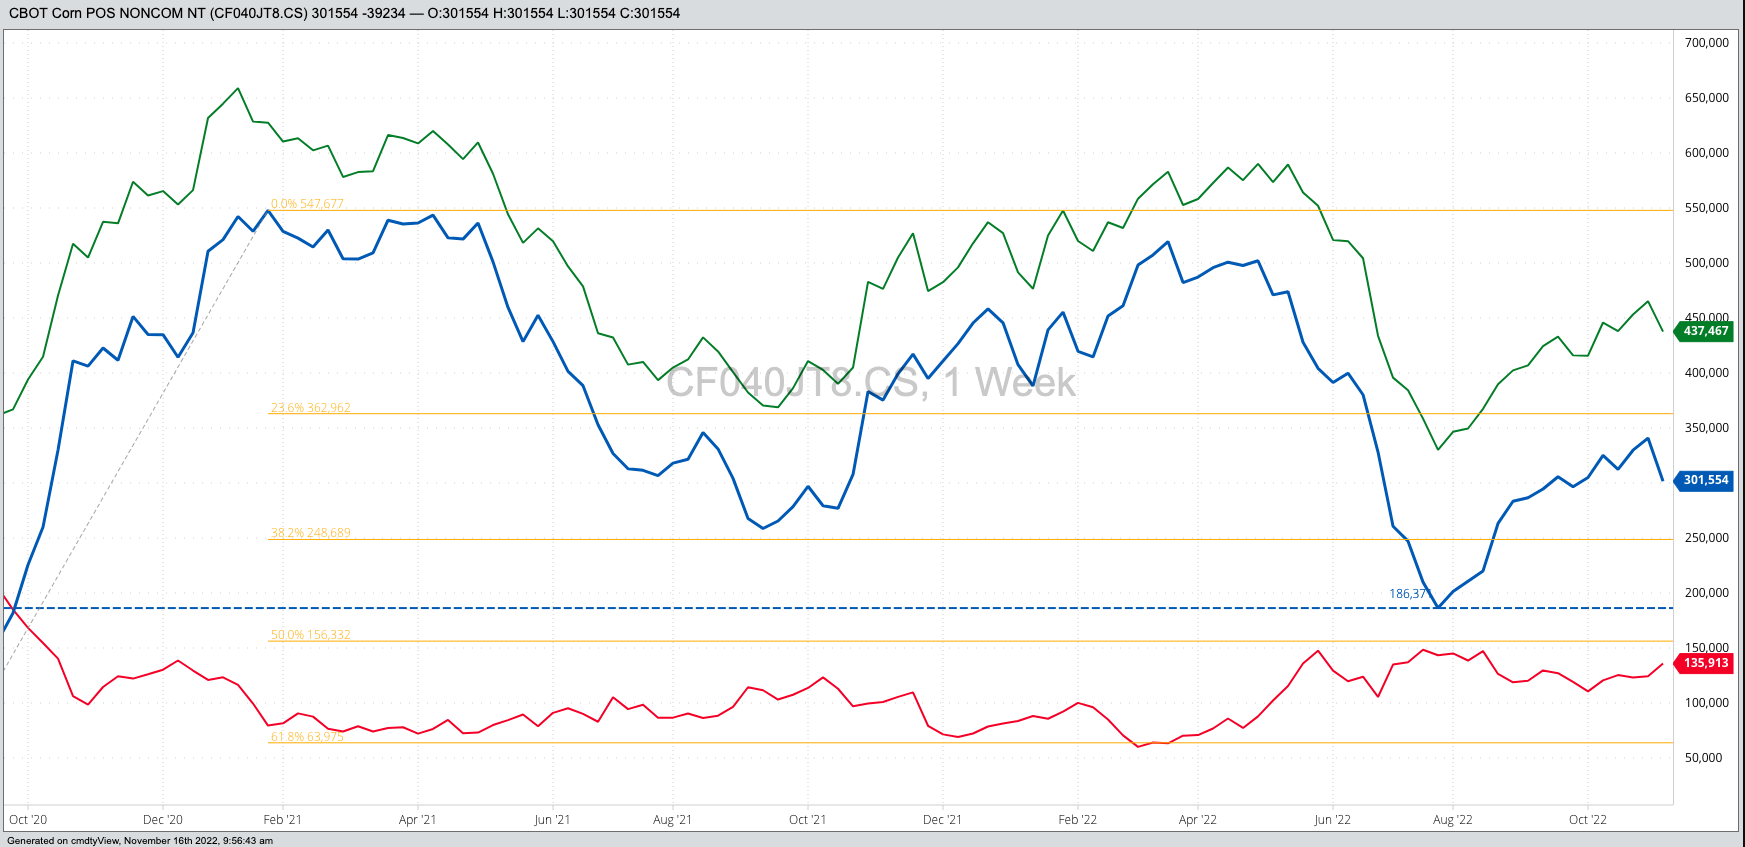
- According to the latest CFTC Commitments of Traders report (legacy, futures only), noncommercial traders decreased their net-long futures position by 39,234 contracts the week ending Tuesday, November 8. This included a decrease of 27,714 contracts of long futures and an increase of 11,520 contracts of short futures.
- This timeframe included the first couple days of the Goldman Roll, meaning large funds were rolling their long December contracts to March by selling Dec and buying March.
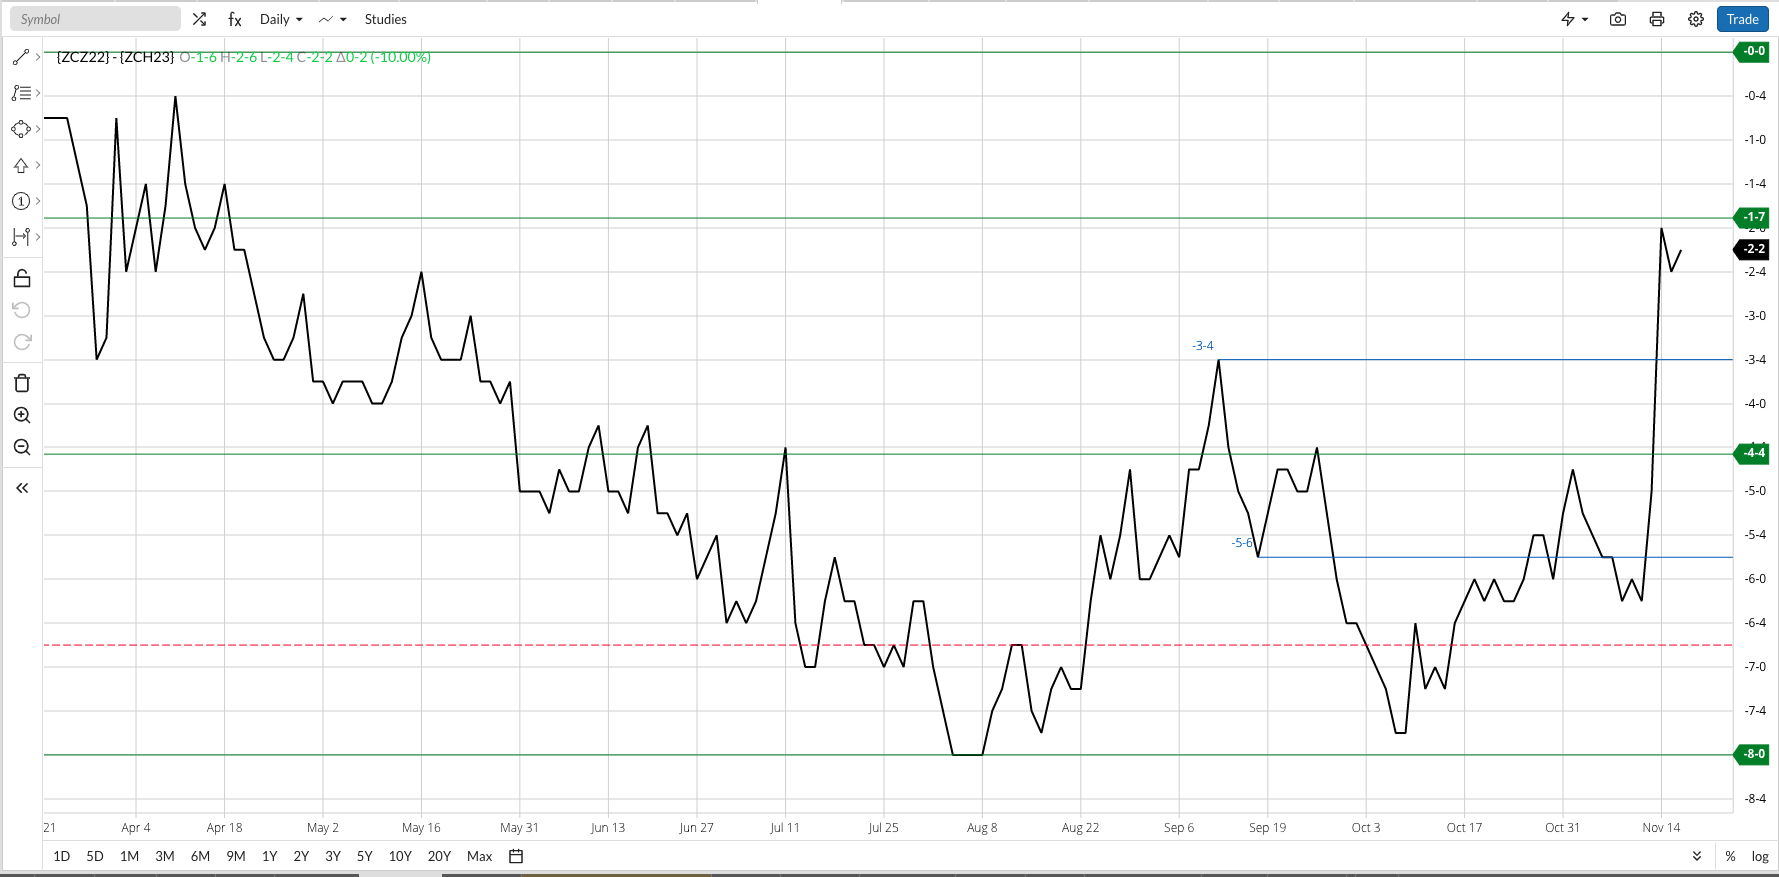
- Meanwhile, the Dec-March spread did see its carry strengthen from 4.75 cents (November 1) to 6.25 cents (November 8). The spread also closed at 6.25 cents carry on Thursday, November 10 before rocketing to a close of only 2.0 cents carry on Friday, November 10, the last day of the Roll.
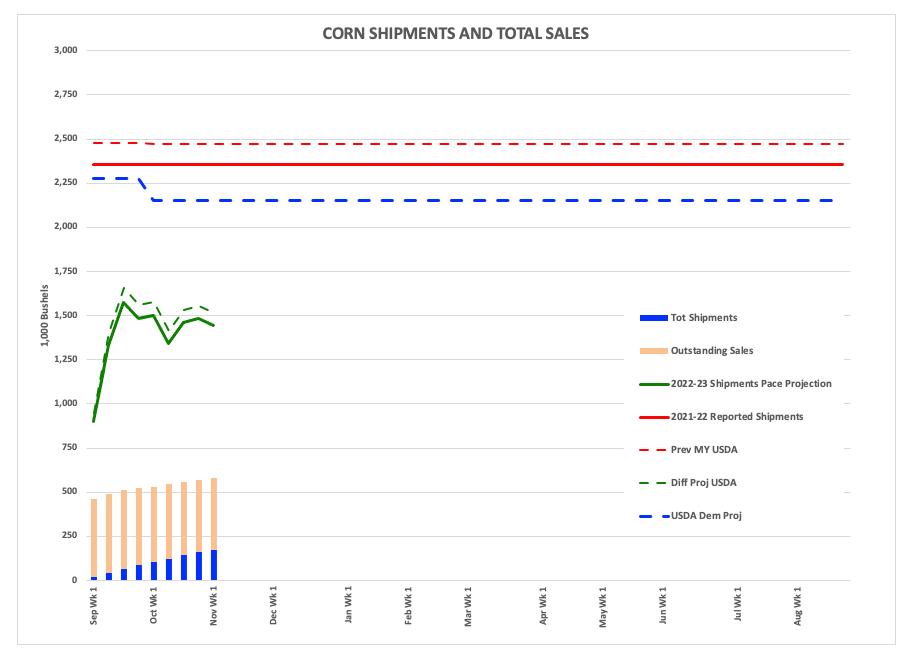
What was the market trying to tell us? If we add in the fact national average basis continued to firm while the carry in the Dec-March futures spread was strengthening, we know commercial traders were still pushing the cash market to source supplies to meet strong demand. We also know there hasn’t been much in the way of exports, with the latest weekly export sales and shipments update showing total sales of only 580 mb through Thursday, November 3. This was down 54% from the same week the previous year. With exports near non-existent, we know strong basis was a factor of domestic demand.
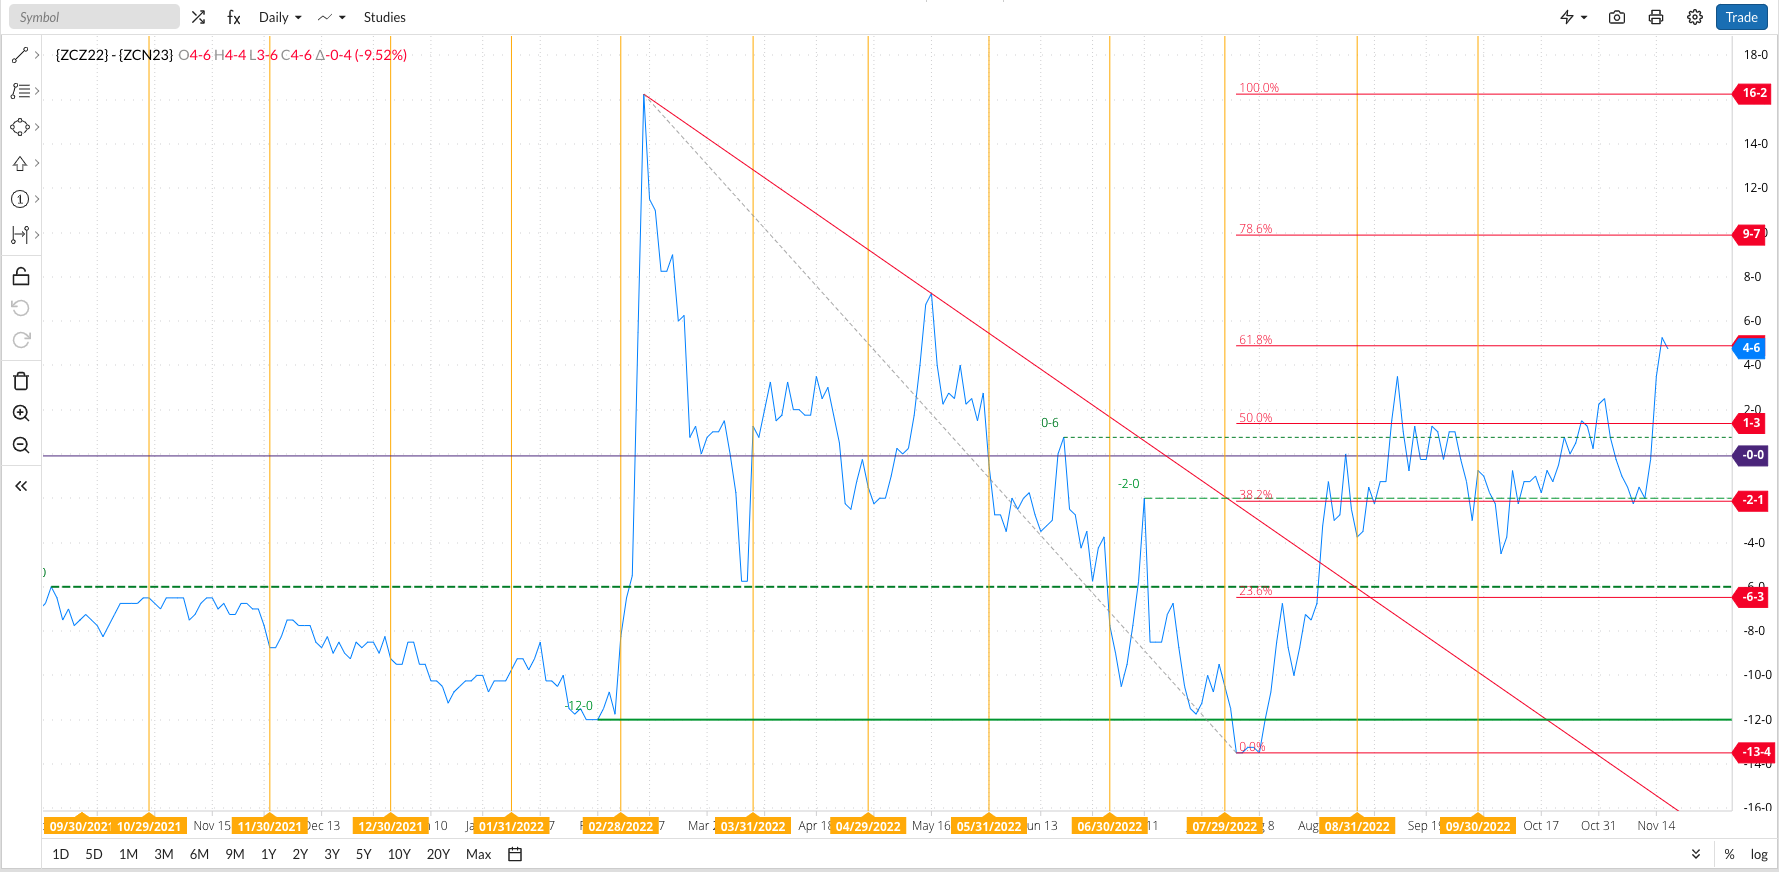
But then things got interesting. Again, the Dec-March spread jumped to finish out last week, but it wasn’t alone. The long-term Dec-July spread also raced from a carry of 2.25 cents (November 8) to an inverse of 5.25 cents at Tuesday’s close. This tells us there was some long-term buying going on in the market as well, meaning exporters must’ve been making some sales and lifting hedges. The past week-plus has seen USDA announce 2022-2023 corn sales to Mexico of:
- November 8: 338,600 mt (13.3 mb)
- November 10: 209,931 mt (8.3 mb)
- November 15: 230,185 mt (9.1 mb)
- November 16: 1,242,060 mt (44.3 mb)
- With another 624,840 mt (24.6 mb) of 2023-2024 thrown in for good measure
So the market has been telling us, through basis and spreads, that demand is not only strong but increasing as export sales start to wake up. Seasonally, the US tends to ship most of its corn the second half of the marketing year, meaning from March 1 through August 31. But what will US available stocks-to-use be when it comes time to start loading all these sales to Mexico?
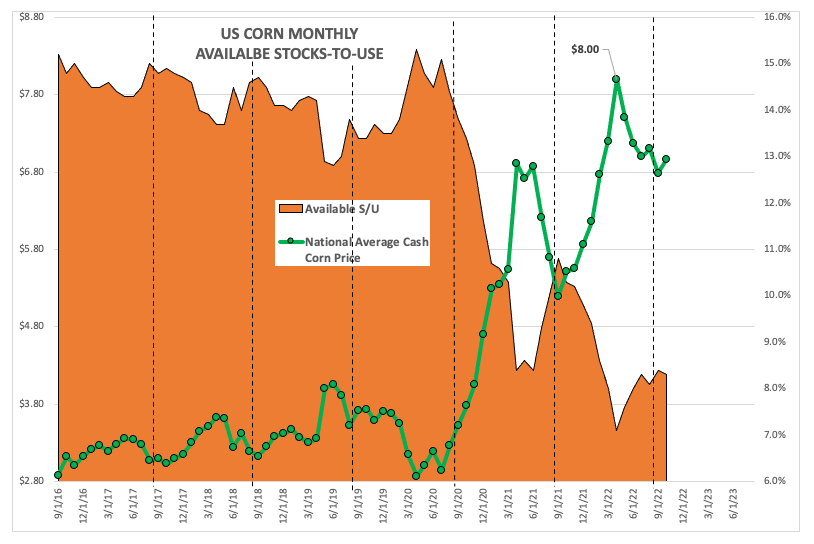
My end of October available stocks-to-use calculation, based on its correlation with national average cash price ($6.9675 on October 31), came in at 8.3%. This was down from the end of September’s 8.4%, despite the bulk of harvest occurring during October. Last October my number came in at 10.3% based on a national average cash price of $5.5150.
In summary, our three key reads on real fundamentals continue to speak volumes about short-term available stocks-to-use, immediate demand, and long-term supply and demand. We just have to be willing and able to listen.
More Grain News from Barchart
- Wheat Fading With More Missile Info
- Soy Futures Fading with Grains Complex
- Red Start for Midweek Corn
- Wheats Gain on Tuesday
/Advanced%20Micro%20Devices%20Inc_%20office%20sign-by%20Poetra_RH%20via%20Shutterstock.jpg)
/Alphabet%20(Google)%20Image%20by%20Markus%20Mainka%20via%20Shutterstock.jpg)


/Tesla%20Inc%20logo%20by-%20baileystock%20via%20iStock.jpg)