
Tariffs, Trade Wars, and the Tug-of-War Driving the Red Metal
Industrial metals, and copper in particular, have been at the center of one of the most policy-driven commodity markets in years. Having rallied from the beginning of 2025 largely on mounting concerns over the impacts of incoming U.S. tariffs, copper futures prices went on a rollercoaster ride throughout much of the year, with further trade-tariff escalations under the Trump administration keeping copper prices in a state of pronounced volatility.
The narrative heading into 2026 carried much of the same tension. On January 17, 2026, Trump threatened tariffs of up to 25% on goods from eight European countries as part of the Greenland Crisis, before retracting the threat on January 21 after saying he had reached a framework of a future deal with NATO Secretary-General Mark Rutte. This rapid policy whipsaw injected a sharp but short-lived jolt into metals markets.
Beyond tariff headlines, copper remains sensitive to a wider set of macro and structural factors. The escalation of U.S.-Iran tensions into open conflict drove oil prices sharply higher, stoking recession fears and weighing on risk appetite across equity and bond markets, a dynamic that bears directly on Dr. Copper as a bellwether of global economic health. Soft Chinese demand remains another persistent drag, as the country continues to feel the effects of a prolonged real estate downturn that has resisted multiple rounds of stimulus. On the structural demand side, the long-term drivers remain intact: electrification, data centers, EV adoption, and grid upgrades continue to underpin the bull case for the metal. A copper shortage loomed as tariff fears and mine disruptions fueled tightness as recently as March 2026. The net result is a market that is simultaneously bullish on fundamentals and fragile on macro, making it highly reactive to any shift in the geopolitical or trade policy landscape.
What the Market Has Done
- The market has been in a consolidation between 6.10 (daily level 1) and 5.63 (daily level 2) since January, establishing a broad range as participants balance conflicting macro signals.
- At the end of January, there was a volatility spike above the consolidation range followed by a sharp rejection back into value.
- From 27 February, sellers stepped down offers within consolidation block 2, compressing price action toward 5.63 (daily level 2) as risk sentiment deteriorated and rate expectations repriced higher.
- In mid March, sellers were able to break below consolidation block 2, leading to a rotation lower toward 5.3 (daily level 3 / high of consolidation block 1), where responsive buyers stepped in and held bids.
- In the past week, bids have steadily stepped up from 5.3, driving a rotation back higher toward 5.63 (daily level 2), signaling a potential shift in short term control back to buyers.
What to Expect in the Coming Weeks
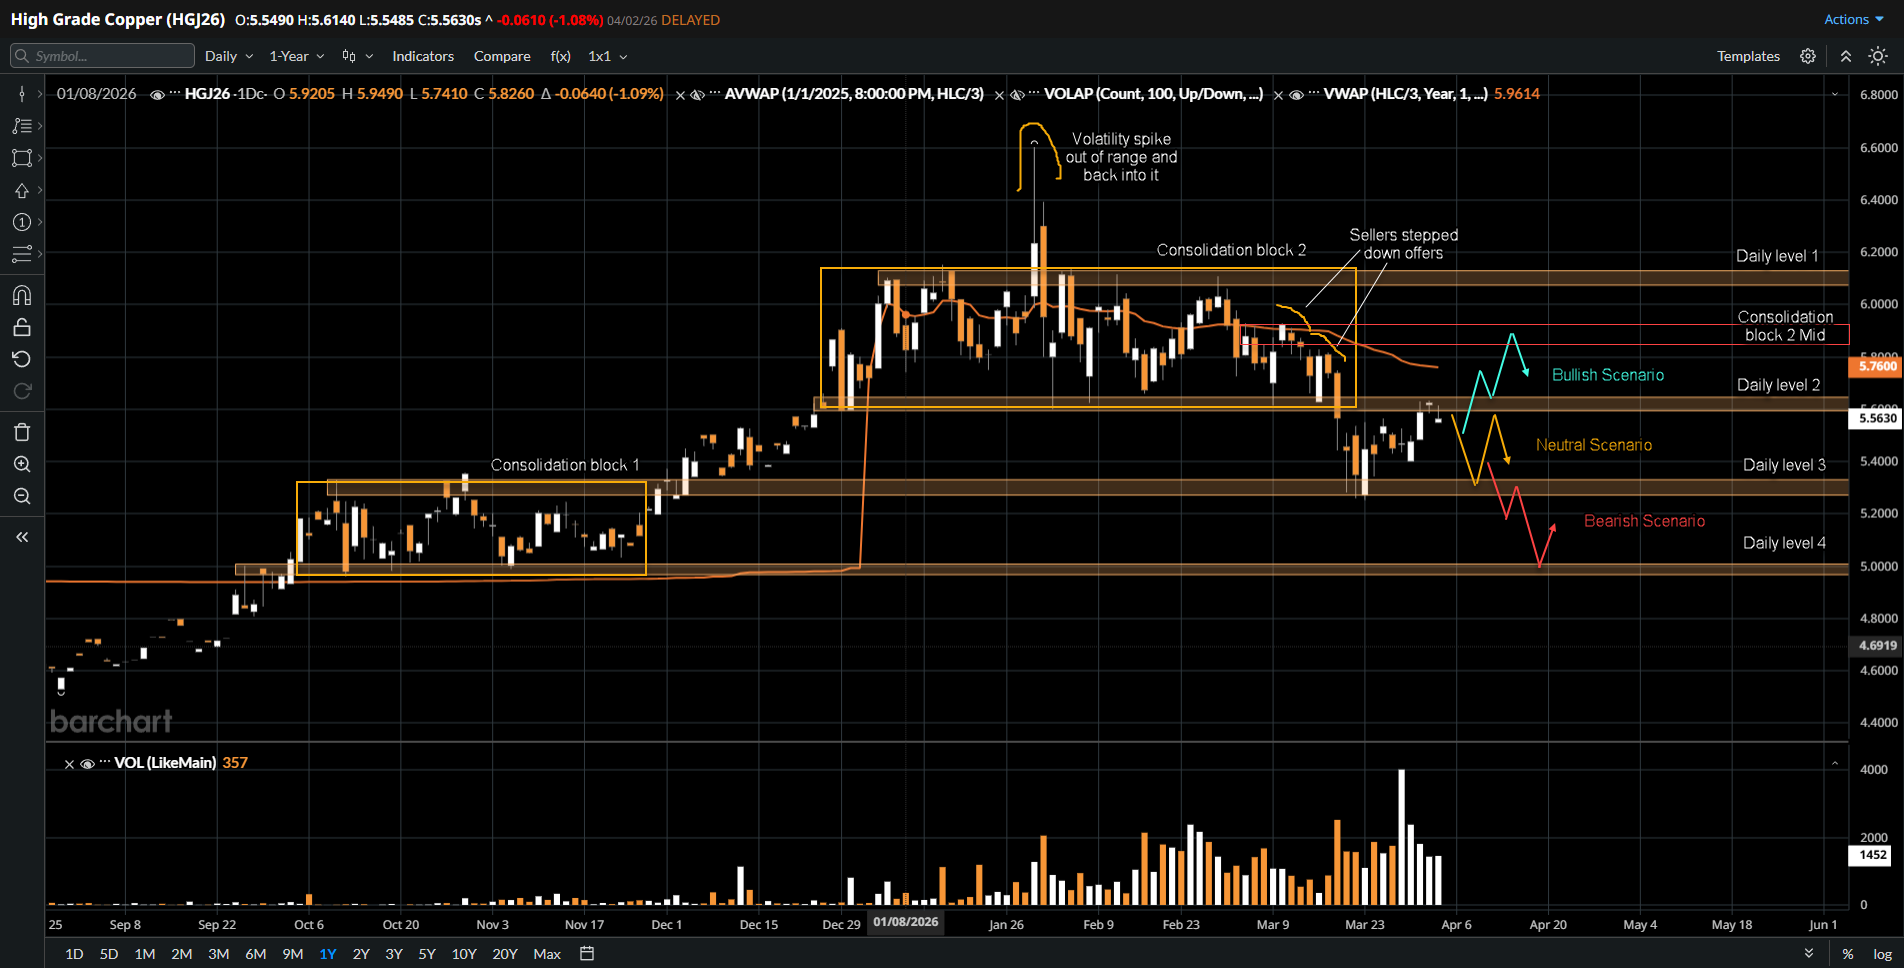
The key level to watch remains 5.63 (daily level 2), which will likely determine the next directional move.
Neutral Scenario
- If sellers are able to hold offers at 5.63 (daily level 2), expect a rotation back down toward 5.30 (daily level 3), with two way rotation developing between these two levels as the market works to establish value lower.
- This scenario would likely be driven by a continuation of elevated geopolitical risk in the Middle East, which keeps energy prices firm and dampens global growth expectations, weighing on industrial metals demand without triggering a full risk off move.
Bullish Scenario
- If the market is able to break and accept above 5.63, expect rotation higher toward the yearly VWAP and potentially toward 5.90 (midpoint of consolidation block 2), where sellers are expected to respond.
- If sellers do not hold offers at 5.90, a further move back toward 6.10 (daily level 1) becomes the next logical target.
- This scenario would likely be supported by improving global risk sentiment, particularly through a de-escalation in trade tensions between the United States and China, or stronger Chinese demand data that reinforces expectations of a recovery in industrial activity.
Bearish Scenario
- If buyers are not able to defend bids at 5.30 (daily level 3), expect a rotation lower into consolidation block 1, targeting 5.0 (daily level 4), where buyers are expected to respond.
- This scenario would likely be triggered by a deterioration in United States economic data, particularly in manufacturing or consumer spending, signaling that growth is slowing more sharply than expected.
- Given copper’s role as a leading indicator of global economic activity, confirmation of demand destruction from either the United States or China would likely be sufficient to drive a decisive break lower.
Conclusion
Copper is once again testing a critical pivot at 5.63, a level that has consistently defined the balance between buyers and sellers within the current range. From a technical perspective, acceptance above this level would signal a shift in control back to buyers and open the path toward 5.90 and potentially a retest of 6.10. Failure to break higher would reinforce the broader consolidation and increase the likelihood of another rotation back toward 5.30 or lower.
From a macro standpoint, the market remains highly reactive to policy and geopolitical developments. Trade tensions, particularly between the United States and China, continue to shape demand expectations, while elevated geopolitical risk in the Middle East and its impact on energy prices adds another layer of uncertainty. At the same time, underlying supply tightness and long term demand drivers such as electrification and infrastructure investment continue to support the structural bull case.
Ultimately, the next move in copper will likely require a clear catalyst, whether through improving global growth expectations or a further deterioration in macro conditions. Until then, price action around 5.63 should serve as the clearest signal of whether the market is preparing for a breakout or another rotation within the range.
If you are looking for evergreen content sourced from the desks of professional traders, this is the definitive resource for your technical workflow. Combine world-class insights with a world-class platform. Open an Account today.
Disclaimer:
This article is provided for informational and educational purposes only and does not constitute financial, investment, or trading advice. The analysis presented reflects the author’s market observations and opinions at the time of writing and is not a recommendation to buy or sell any futures contract, security, or financial instrument. Futures trading involves significant risk and is not suitable for all market participants. Losses may exceed initial margin deposits, and market conditions can change rapidly.
Any scenarios, levels, or market expectations discussed are hypothetical in nature and are intended solely to illustrate potential market behavior. They do not represent actual trading results and should not be interpreted as guarantees of future performance. Past performance, market behavior, or historical price action are not indicative of future outcomes.
Readers are solely responsible for their own trading decisions and risk management. Always conduct independent research, consider your financial situation and risk tolerance, and consult with a qualified financial professional, if necessary, before engaging in futures or derivatives trading.


/NVIDIA%20Corp%20logo%20outside%20building-by%20BING-JHEN_HONG%20via%20iStock.jpg)
/Elon%20Musk%2C%20founder%2C%20CEO%2C%20and%20chief%20engineer%20of%20SpaceX%2C%20CEO%20of%20Tesla%20by%20Frederic%20Legrand%20-%20COMEO%20via%20Shutterstock.jpg)
