The information and opinions expressed below are based on my analysis of price behavior and chart activity
Sign Up to receive Walsh Trading’s 1st Half of 2026 Market Outlook First Half of 2026 Outlook for the Livestock and Grain markets.
Tuesday, March 31, 2026
May Wheat (Daily)
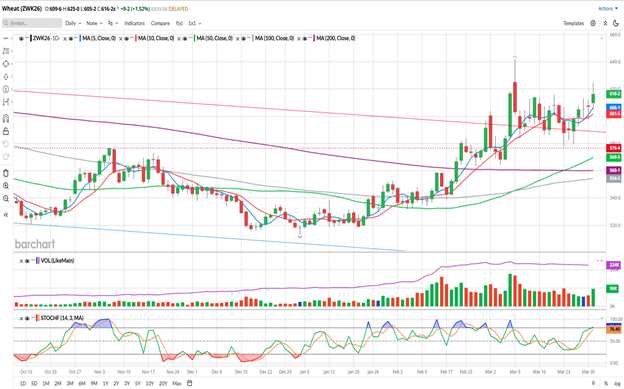
May Wheat settled at 6.16 ¼, up 9 ¼ cents on the day. Today’s settlement marks the highest May Wheat has closed since March 6th, and is just ½ cent shy of that day’s close.
Today market trade was driven (mostly) by USDA data. The Quarterly Grain Stocks report pegged US ending stocks at 1.306 billion bushels, up from 1.237 billion at this time last year. The Prospective Plantings for all US Wheat came it at 43.775 million acres, a decline from the USDA’s “final” acreage of 45.328 million acres in 2025.
Traders can now turn their focus to the weather and the potential impact on the HRW crops and the Spring Wheat plantings. The drought map has been getting worse and crop conditions in TX, OK and KS have been declining. Only 13% of OK Wheat, 14% of TX and 40% of KS crops are in the good to excellent rating, all below the ratings at this time last year and all working lower on a week-to-week basis. Those folks need some rain, in a big way. I’m not going to play weather-guesser here, but nearly everyone that I’ve talked to across TX, OK and KS have told me that the crop looks bad. I’m not sure if rains can reduce or reverse the damage that’s already occurred.
On the chart above, I’d like to point out a few things. With yesterday’s trade, the 5- and 10-day moving averages (blue, red) made a bullish crossover, reversing the bearish cross from March 20th. Those averages are now offering potential support at 606 1/8, and 601 5/8, respectively. The 50-day (green, 5.69 5/8) crossed back up above the 200-day average (purple, 5.60 1/8) a week ago today, which I would also consider a bullish sign. The 50-day also crossed above the 100-day back on March 9th, indicating a turn of the medium-long term trends to me. The dotted red horizontal line marks the November high and while the market got close last week Monday, it hasn’t been tested. The solid red trendline denoted the top of a trend channel, while the lower solid blue trendline indicates the lower end of that channel. To my eye, the market has tested the upper end of that and it has held as support for the past month or so, following the initial breakout attempt Feb. 27th-Mar. 2nd. Daily Stochastics (bottom sub-graph) are getting close to overbought, since turning back up last week. It may not be a straight move higher from here, but in my opinion, the Wheat market has turned bullish.
May Wheat (Weekly)
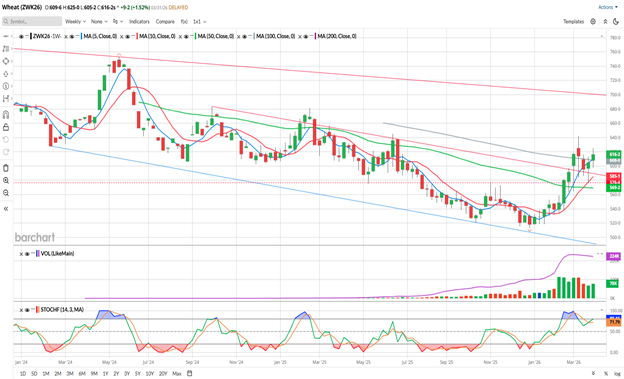
The weekly May Wheat chart shows potential resistance near the March high of 6.41 ¾, the June 2025 high of 6.45 ¼ and then the Feb 2025 high of 6.81 ½. Beyond those, the next target would be the long-term weekly trendline (red) up near 7.00.
The 5- and 10-week moving averages (blue/red) made a bullish crossover in early February of this year, and while the 50- (green) and 100-week averages are still declining they are both below the market offering potential support levels. Stochastics on the weekly view appear to be headed back up toward an overbought condition, but they’re not there yet. The recent trade is the first time over this chart view that this market hasn’t gone from overbought and trended immediately back to oversold.
Aggressive and well-margined traders may do well to consider long futures positions in May Wheat. I think an entry at/near the 5-day moving average (6.06 1/8 today) may work out well. A protective sell stop at 15 cents below your entry price would be a $750 risk per contract, before your commissions/fees. I would look to exit the position on a push back to the March high at 6.41 ¾. That would result in a gain of about $1,775 per contract, before your commissions/fees.
For those that prefer options, the May Wheat options expire in 24 days. Give me a call if you need specific ideas or strike prices.
Sign Up to receive Walsh Trading’s 1st Half of 2026 Market Outlook First Half of 2026 Outlook for the Livestock and Grain markets.
If you like what you’ve read here and would like to see more like this from Walsh Trading, please Click here and sign up for our daily futures market email.
Jefferson Fosse Walsh Trading
Direct 312 957 8248 Toll Free 800 556 9411
jfosse@walshtrading.com www.walshtrading.com
Walsh Trading, Inc. is registered as a Guaranteed Introducing Broker with the Commodity Futures Trading Commission and an NFA Member.
Futures and options trading involves substantial risk and is not suitable for all investors. Therefore, individuals should carefully consider their financial condition in deciding whether to trade. Option traders should be aware that the exercise of a long option will result in a futures position. The valuation of futures and options may fluctuate, and as a result, clients may lose more than their original investment. The information contained on this site is the opinion of the writer or was obtained from sources cited within the commentary. The impact on market prices due to seasonal or market cycles and current news events may already be reflected in market prices. PAST PERFORMANCE IS NOT NECESSARILY INDICATIVE OF FUTURE RESULTS. All information, communications, publications, and reports, including this specific material, used and distributed by Walsh Trading, Inc. (“WTI”) shall be construed as a solicitation for entering into a derivatives transaction. WTI does not distribute research reports, employ research analysts, or maintain a research department as defined in CFTC Regulation 1.71.


/Microsoft%20sign%20at%20the%20headquarters%20by%20VDB%20Photos%20via%20Shutterstock.jpg)

/Space/Cargo%20spacecraft%20in%20low-Earth%20orbit%20by%20Paopano%20via%20Shutterstock.jpg)