
The information and opinions expressed below are based on my analysis of price behavior and chart activity
Sign Up to receive Walsh Trading’s 1st Half of 2026 Market Outlook First Half of 2026 Outlook for the Livestock and Grain markets.
Monday, March 30, 2026
June Live Cattle (Daily)
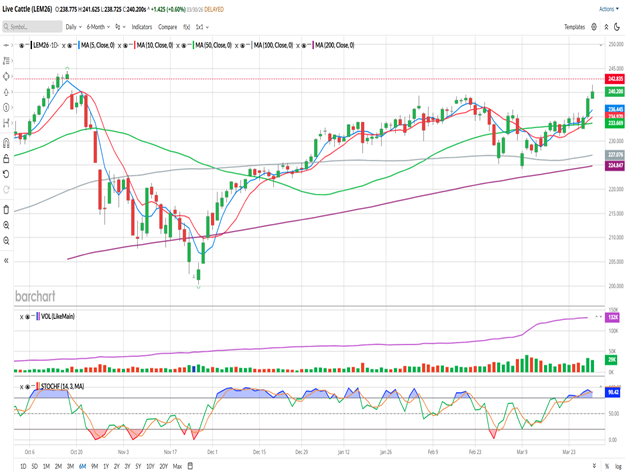
June Live Cattle settled at 240.200 on the day, gaining 1.425 from Friday’s close. At the high end of today’s trade, 241.625, prices did start to get into the gap from October when Trump said beef prices were too high. The market has almost gotten back all of price loss, even though it’s taken a while, and does appear like it wants to continue to move up. Today’s close is the highest since the contract high close on October 16th. The nearby April and the deferred contracts from October on out have not yet gotten with range of filling (or starting to fill) the overhead gaps on their respective chart, but they all posted a strong close today. That gap remains in place, to the dotted red line on the chart above at 242.825.
On Friday of last week, the strong close above last Wednesday’s high was significant, I think. That Friday close last week was what I would call the first directional close following that Doji, or equilibrium day, when a market closes the day/bar at the same price. I think that was a positive development for the bulls out there.
The 5- and 10-day moving averages (blue/red) have been in a bullish configuration since March 18th and both of those averages offered good support, I think, to last week’s trade. Today those averages are at 236.445 and 234.970, respectively. The 50-day (green, 233.669) has mild uptrend to it and also seem to act as support throughout the week. The 100- and 200-day averages (grey and purple) are well below the market and also inclined toward higher prices. Trade Volume (1st sub-graph) today, while not the highest we’ve seen, was higher than every day last week, except Friday, and the two last days have been the highest this market has seen since March 12th. Stochastics (bottom) have been an overbought condition since last Wednesday. Over the view of this chart, Cattle prices seem to have preferred being overbought to oversold. There is a “tail” on today’s bar, but my guess is that it means some profit taking, rather than new selling pressure.
Last weeks Commitment of Traders data did show an increase in Managed Money in Live Cattle by about 4,300 contracts to the long side, adding to the bullish fund positions.
From my perspective, I expect Cattle prices to head back up to the contract high of 244.475 from October 16th. There may be some resistance or profit-taking there, as that’s the next level of tangible technical chart resistance. Beyond that, the speculative targets of 245.000 or 250.000 (big, round numbers) seem to be reasonable and in play.
Aggressive and well-margined traders may do well to consider long Futures positions. Perhaps an entry near today’s low of 238.725 or the 5-day moving average near 236.500 or so would work for you. I think your risk is likely just under last week’s low of 232.375. From the higher entry point, that would work out to a potential risk of 6.350 or $2,540 per contract, before your commissions/fees. A profit target near the contract high of 244.475 would result in a gain of $2,300 per contract before your commissions/fees. Not an optimal risk/reward, in my opinion, based on the daily charts, but the weekly chart is also starting to turn back to the bullish side, to my eye. Perhaps following the market with a trailing stop along the 10-day average might work better, depending on your entry point and risk tolerance.
Slaughter data continues to decline on a weekly basis, as compared to the same time last year. Imports of beef have been at record levels, and climbing, but that does little to change the actual US supply/demand equation. I think we still have less Cattle and more people to feed.
June Live Cattle (Weekly)
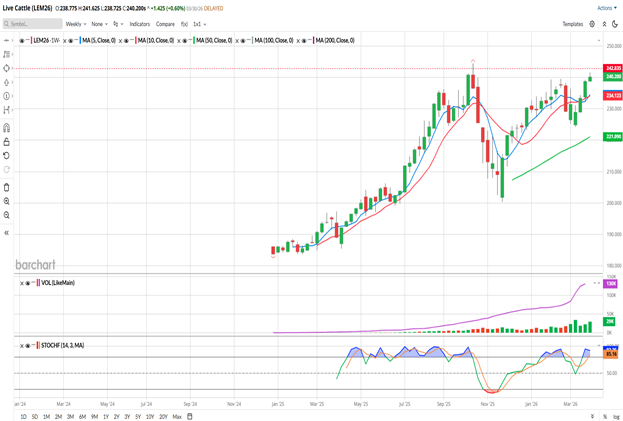
I know, it’s only Monday, but the weekly June Live Cattle chart seems to be turning back to the bullish side. The 5- and 10-week moving averages are making a bullish crossover, in a bit of whipsaw action, potentially reversing the bearish cross those averages made 2 weeks ago. I think it’s unusual for signals like that to change direction that quickly. Obviously, it does happen from time to time, but not very often, in my opinion.
Those averages are blue and red, with the 5-week offering potential support at roughly 234.550 and the 10-week at 234.125. Both are inclined toward higher prices, as is the 50-week (green) near the 221.100 level.
Weekly stochastics (bottom sub-graph) are in overbought territory, but this market has preferred the overbought conditions to oversold over the life of this chart.
Again, it’s only Monday, in a shortened trading week at that. We’ll have to stay tuned through Thursday’s close to see if the bullish start to the week means a bullish finish.
Sign Up to receive Walsh Trading’s 1st Half of 2026 Market Outlook First Half of 2026 Outlook for the Livestock and Grain markets.
If you like what you’ve read here and would like to see more like this from Walsh Trading, please Click here and sign up for our daily futures market email.
Jefferson Fosse Walsh Trading
Direct 312 957 8248 Toll Free 800 556 9411
jfosse@walshtrading.com www.walshtrading.com
Walsh Trading, Inc. is registered as a Guaranteed Introducing Broker with the Commodity Futures Trading Commission and an NFA Member.
Futures and options trading involves substantial risk and is not suitable for all investors. Therefore, individuals should carefully consider their financial condition in deciding whether to trade. Option traders should be aware that the exercise of a long option will result in a futures position. The valuation of futures and options may fluctuate, and as a result, clients may lose more than their original investment. The information contained on this site is the opinion of the writer or was obtained from sources cited within the commentary. The impact on market prices due to seasonal or market cycles and current news events may already be reflected in market prices. PAST PERFORMANCE IS NOT NECESSARILY INDICATIVE OF FUTURE RESULTS. All information, communications, publications, and reports, including this specific material, used and distributed by Walsh Trading, Inc. (“WTI”) shall be construed as a solicitation for entering into a derivatives transaction. WTI does not distribute research reports, employ research analysts, or maintain a research department as defined in CFTC Regulation 1.71.
/Micron%20Technology%20Inc_billboard-by%20Poetra_RH%20via%20Shutterstock.jpg)

/Netflix%20open%20on%20tablet%20by%20rswebsols%20via%20Pixabay.jpg)
/Tesla%20Inc%20logo%20by-%20baileystock%20via%20iStock(1).jpg)