Bonds Under Fire: How the Iran War Flipped the Rate Narrative
Bond sentiment has undergone a sharp reversal since late February 2026. Through January and into early February, a softening macro backdrop had fueled a strong rally in Treasuries. Weakening consumer confidence, a cooling labor market, and ISM Manufacturing data stuck in contractionary territory fed a narrative that the Federal Reserve would resume cutting rates sooner than expected. Oil prices were also subdued, removing a key inflationary tailwind. That combination drove the 10 year Treasury yield down to 3.96% by the end of February, and ZN was bid accordingly.
That narrative collapsed on February 28, when United States strikes against Iran commenced and the conflict began. Rather than triggering a traditional flight to safety bid into Treasuries, the war has acted as an inflationary shock, driving bond prices sharply lower. The Strait of Hormuz, through which roughly one fifth of the world's petroleum transits, has experienced severe disruptions. Brent crude surged from approximately $72 per barrel in late February to over $112 by late March, a gain of more than 55% in under a month. That energy shock fed directly into inflation expectations, rendering a Fed rate cut in 2026 politically and mathematically difficult.
The Federal Open Market Committee voted 11 to 1 on March 19 to hold its benchmark rate steady at 3.50% to 3.75%, acknowledging the inflation pressures building from the conflict. By March 27, the 10 year Treasury yield had climbed to 4.46%, its highest level since July 2025. Markets have now fully priced out further Fed easing in 2026, with odds of an outright rate hike by December approaching 50%. Weak demand at Treasury auctions for two year, five year, and seven year notes this past week compounded the pressure, as the Pentagon reported request of $200 billion in emergency war funding widened deficit concerns. The MOVE index, which tracks volatility in the Treasury market, has spiked to levels consistent with price instability and policy uncertainty.
ZN is presently most sensitive to oil price developments and any signal of de-escalation or further intensification in the Middle East, as well as upcoming inflation data and any change in Federal Reserve forward guidance.
What the Market Has Done
- The market has traded in a largely sideways range since September 2025 between 113-160 (daily level 1) and 111-300 (daily level 2), reflecting a balanced auction structure.
- In January 2026, sellers attempted to break lower but buyers absorbed supply at 111-100, forming Daily level 3.
- In February 2026, the market rotated back into the consolidation range as shorts liquidated following the failed breakdown.
- In March 2026, buyers attempted to break above the consolidation range but promptly failed, and the market rotated back down through the range. This failure coincided with the sharp repricing in yields following the escalation of the Iran conflict and the surge in oil prices, which shifted expectations toward tighter monetary policy.
- More recently, sellers attempted another move lower below the consolidation range, and offers were able to hold at 111-300 (daily level 2). The market extended lower to 111-000 (daily level 4), where buyers have responded, forming the current auction block between 111-04 and 110-000. This reflects responsive buying as yields approached recent highs, even as macro pressure remains elevated.
What to Expect in the Coming Weeks
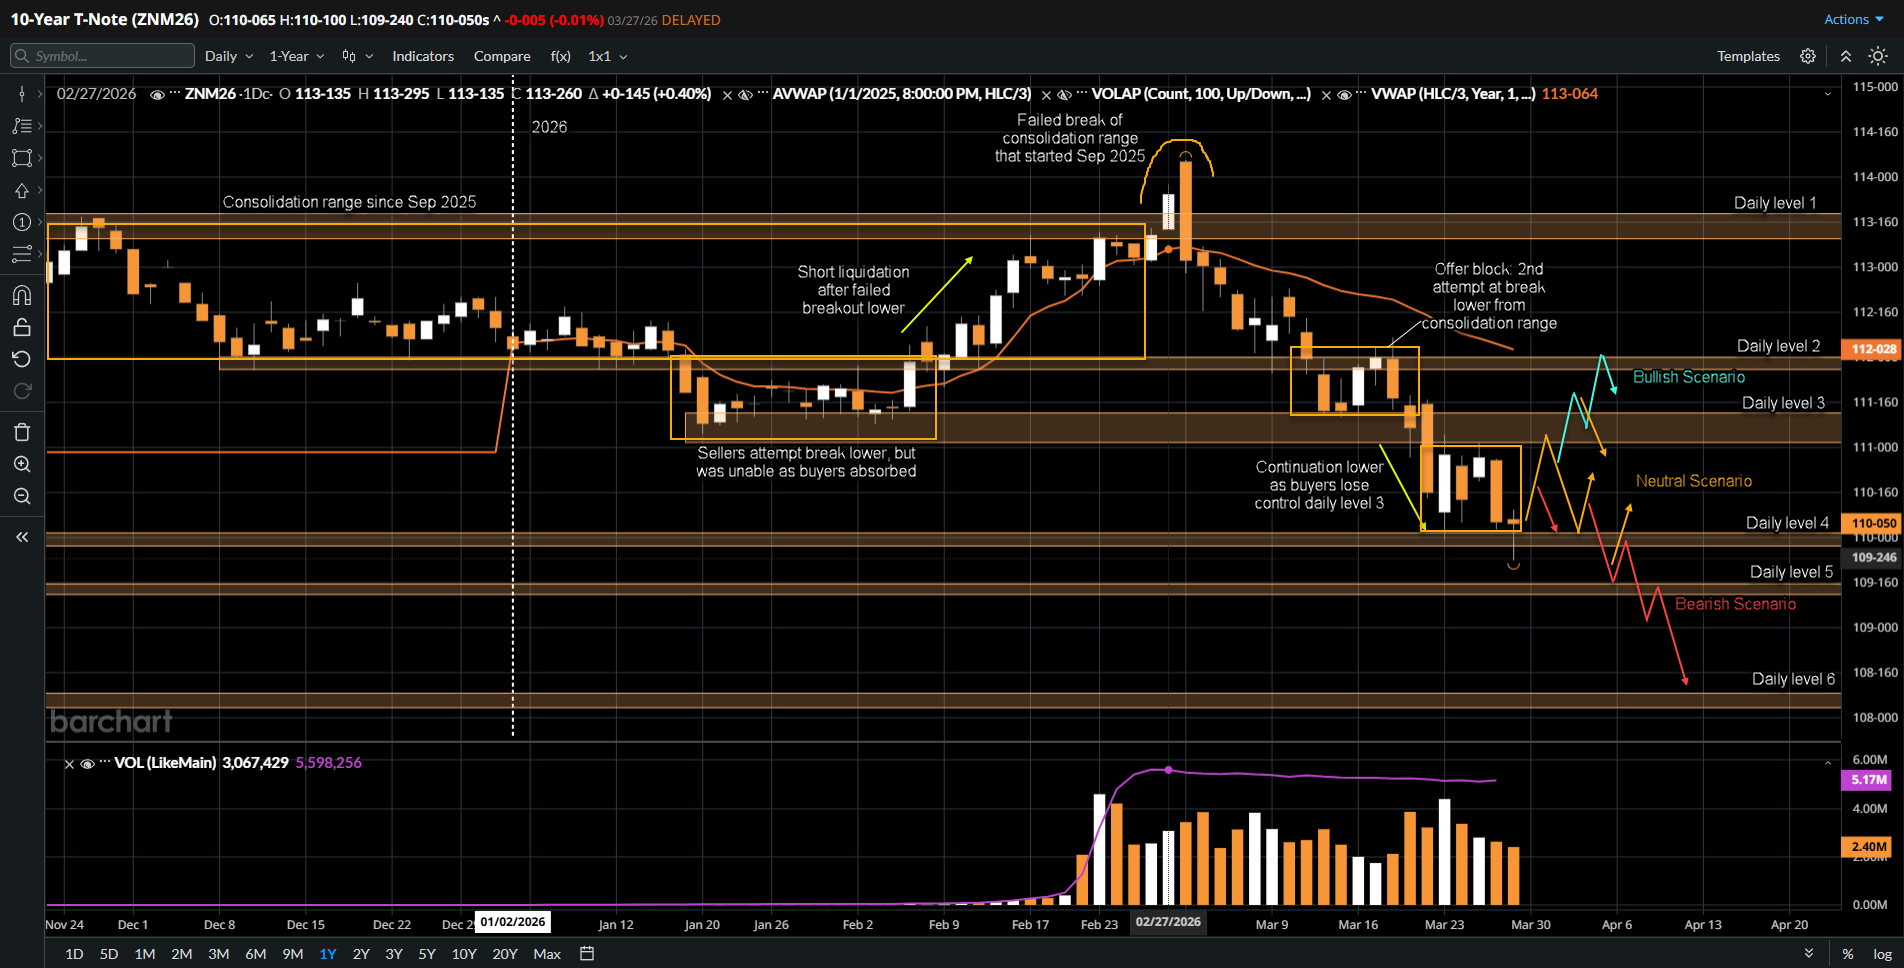
The key level to watch remains 111-000 (Daily level 4).
Neutral Scenario
- The market rotates within the current auction block range as participants await further catalysts from inflation data, developments in the Middle East, and upcoming Treasury auctions.
- Balance conditions persist as neither buyers nor sellers achieve sustained acceptance outside of the current range.
Bearish Scenario
- The first clue for a bearish scenario is if sellers begin to step down offers within the auction block, signaling continued supply pressure.
- If sellers break and accept below 111-000, expect a move down to 109-150 (Daily level 5), where buyers are expected to respond.
- If buyers fail to respond, expect continuation toward 108-090 (Daily level 6), particularly if oil prices remain elevated and yields continue to push higher.
Bullish Scenario
- The first clue for a bullish scenario is if buyers are able to hold bids above the mid of the consolidation range and compress toward 111-100 (Daily level 3).
- If buyers break and accept above 111-100, expect a move higher through the offer block toward 111-300 (Daily level 2).
- Sustained upside would likely require a meaningful pullback in oil prices or clear signs of de-escalation in the Middle East, alongside softer inflation data.
Conclusion
ZN is transitioning from a balanced range into a more fragile structure under macro pressure. Technically, 111-000 remains the defining pivot, with price acceptance below signaling continuation toward lower value areas, while a reclaim of 111-100 would suggest a return to balance and potential rotation higher.
From a macro perspective, the shift has been decisive. The Iran conflict has transformed the narrative from disinflation and rate cuts to renewed inflation risk and higher for longer policy expectations. Rising yields, weak auction demand, and elevated volatility all reinforce the pressure on bonds. At the same time, the presence of responsive buyers at lower levels shows that value is still being found, particularly during spikes in yields.
The next directional move will likely hinge on whether inflation pressures persist through energy markets or begin to ease, and whether geopolitical tensions escalate further or stabilize. Traders should remain focused on both order flow at key levels and the evolving macro backdrop.
For participants requiring precise and high-caliber market intelligence, our technical updates on Barchart provide the analytical foundation your trading business needs. Access top-tier data and professional-grade market commentary designed to optimize your execution on our futures trading platform and refine your methodology. Build your trading business on a professional foundation. Open an Account today.
Disclaimer:
This article is provided for informational and educational purposes only and does not constitute financial, investment, or trading advice. The analysis presented reflects the author’s market observations and opinions at the time of writing and is not a recommendation to buy or sell any futures contract, security, or financial instrument. Futures trading involves significant risk and is not suitable for all market participants. Losses may exceed initial margin deposits, and market conditions can change rapidly.
Any scenarios, levels, or market expectations discussed are hypothetical in nature and are intended solely to illustrate potential market behavior. They do not represent actual trading results and should not be interpreted as guarantees of future performance. Past performance, market behavior, or historical price action are not indicative of future outcomes.
Readers are solely responsible for their own trading decisions and risk management. Always conduct independent research, consider your financial situation and risk tolerance, and consult with a qualified financial professional, if necessary, before engaging in futures or derivatives trading.

/Micron%20Technology%20Inc_billboard-by%20Poetra_RH%20via%20Shutterstock.jpg)

/Netflix%20open%20on%20tablet%20by%20rswebsols%20via%20Pixabay.jpg)
/Tesla%20Inc%20logo%20by-%20baileystock%20via%20iStock(1).jpg)