The information and opinions expressed below are based on my analysis of price behavior and chart activity
Sign Up to receive Walsh Trading’s 1st Half of 2026 Market Outlook First Half of 2026 Outlook for the Livestock and Grain markets.
Thursday, March 5, 2026
If you like this article and would like to receive more information on the commodity markets from Walsh Trading, please use the link to join our daily email list -Click here
July Corn (Daily)
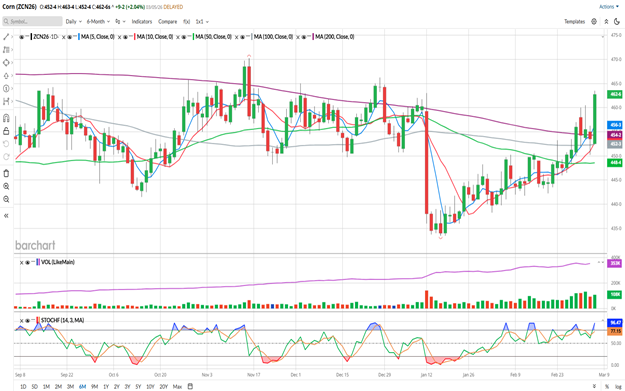
Today, July Corn gained 9 ¼ cents, to close at 4.62 ¾. I think that today’s activity was significant for several reasons. The close was the highest since the day after Christmas. You might notice by looking at the chart that today’s trade engulfed not only Wednesday’s bar, but Monday and Tuesday’s, as well. You may also see the 200-day moving average (purple, 4.54 ¼) and see that the market settled some 8 ½ cents above that, the largest differential that’s visible on this view and the highest above that long=term average since May of 2025. And we’ve finally seen July Corn erase all of the bearish price activity that arrived in January with the USDA crop estimate. Basically, nearly all of the technical indicators that I watch are all bullish right now.
The 5- and 10- day moving averages made a bullish crossover on February 24th. Those averages are offering potential support now at 4.56 3/8 (blue) and 4.52 ¾ (red), respectively. The 50-day moving average (green, 4.48 ½) appears to have flattened out over the past week or so and will likely start to turn higher. The 100-day (grey, 4.52 3/8) has acted as support all of this week, with a test on Monday and Wednesday, and is just a hair under today’s low. The gap between the 100- and 200- is narrowing. Those have been in a bearish configuration since last August, and they still are, but recent trade has shown a marked improvement in the trend. The 50- and 100-day averages also remain in a bearish pattern, as they have been since January 23rd, but they are no longer both pointing toward lower prices. Stochastics (bottom sub-graph) are starting to tick up into overbought, but haven’t quite got there yet. Momentum appears to be on the side of the bulls, right now.
According to the Commitment of Traders from last week, the Managed Money folks were short almost 14,000 Corn contracts. Based on this week’s price activity, we may be seeing them flip to the long side. I’m not sure if we’ll see that in tomorrow afternoon’s data or if it will be reflected in next Friday’s release.
Next Tuesday the USDA will release their monthly Supply/Demand estimates. Analyst estimates that I’ve seen suggest a slight increase in domestic and world ending stocks. Traders will also keep a close eye on what the USDA anticipates from Brazil and Argentina’s Corn yields. Last month the USDA was at 131.0 MMT for Brazil and 53.0 MMT for Argentina. I think they may raise the Brazilian crop a bit and lower the Argentinian #’s slightly. Unless there’s a huge surprise there, I’m not sure that report will “move” the markets much. That may come in a few more weeks.
At the end of March, on the 31st, we’ll get the Quarterly Grain Stocks and Prospective Plantings reports. I think that most farmers and producers have already “penciled” their operations and know what they intend to plant or how they’ll adjust their rotation. However, the war with Iran may cause some additional acres to be shifted away from Corn. If producers have already purchased their inputs for the year, they will likely keep there rotation how it’s been set. If they haven’t yet, they may find the sticker shock to be too high and rotate those acres back to Soybeans. And diesel prices have skyrocketed, with the NYMEX HO gaining 90 cents or so, as of this writing, this week. Those higher expenses could easily change the outlook for the year. And, although it’s late in the game to make changes, farmers may be forced to make adjustments.
July Corn (Weekly)
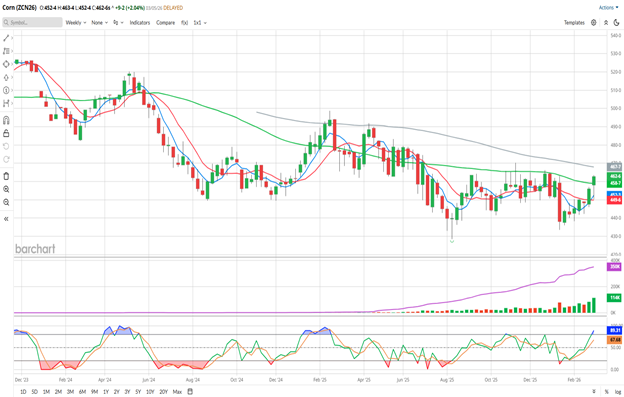
For the week, July Corn is up 6 ¾ cents and today’s settlement is above the 50-week moving average (green, 4.58 7/8) Corn hasn’t had a weekly close above that average since the middle of June 2025 and I think that’s bullish, as long as the market closes out the week above that number. The 5-and 10-week averages are making a bullish crossover this week, and have offered support near 4.52 ¾ and 4.49 ¾, respectively. The 100-week average is above the market, offering potential resistance near 4.67 7/8. Weekly Stochastics (bottom sub-graph) are also just ticking up into overbought, and like the daily above, haven’t quite got there yet.
Aggressive and well-margined traders may do well to consider establishing long futures positions. I would suggest an entry near the 4.60 level, with a protective sell-stop at 4.49. If that stop were hit, that would result in a potential loss of $550/contract, before your commissions/fee. Look to exit that long position near 4.92, the April 2025 high. If that order is triggered, that would result in a gain of 32 cents, or $1,600 before your commissions/fees.
Corn Producers who would like to re-own bushels that they’ve sold, may do well to consider buying the July 5.00/5.50 Call spread. July Corn options expire in 113 days. That option spread settled at 4 ½ cents today, or $225 per spread, before your commissions/fees. I would look to exit that spread at 24 1/2 cents, which would result in a gain of 20 cents, or $1,000 per spread, before your costs. I think that’s a reasonable risk/reward to re-own 5,000 bushels of Corn. Mind the option delta if your intention is to replace 1:1, although if you’ve sold the Corn already, you may not need/want to do that.
You can view Barchart’s seasonal data here. Although, when markets start moving aggressively, the seasonal patterns get tossed out the window, in my opinion.
Sign Up to receive Walsh Trading’s 1st Half of 2026 Market Outlook First Half of 2026 Outlook for the Livestock and Grain markets.
If you like what you’ve read here and would like to see more like this from Walsh Trading, please Click here and sign up for our daily futures market email.
Jefferson Fosse Walsh Trading
Direct 312 957 8248 Toll Free 800 556 9411
jfosse@walshtrading.com www.walshtrading.com
Walsh Trading, Inc. is registered as a Guaranteed Introducing Broker with the Commodity Futures Trading Commission and an NFA Member.
Futures and options trading involves substantial risk and is not suitable for all investors. Therefore, individuals should carefully consider their financial condition in deciding whether to trade. Option traders should be aware that the exercise of a long option will result in a futures position. The valuation of futures and options may fluctuate, and as a result, clients may lose more than their original investment. The information contained on this site is the opinion of the writer or was obtained from sources cited within the commentary. The impact on market prices due to seasonal or market cycles and current news events may already be reflected in market prices. PAST PERFORMANCE IS NOT NECESSARILY INDICATIVE OF FUTURE RESULTS. All information, communications, publications, and reports, including this specific material, used and distributed by Walsh Trading, Inc. (“WTI”) shall be construed as a solicitation for entering into a derivatives transaction. WTI does not distribute research reports, employ research analysts, or maintain a research department as defined in CFTC Regulation 1.71.
/Nvidia%20logo%20and%20sign%20on%20headquarters%20by%20Michael%20Vi%20via%20Shutterstock.jpg)


/Intel%20Corp_%20Santa%20Clara%20campus-by%20jejim%20via%20Shutterstock.jpg)