
The information and opinions expressed below are based on my analysis of price behavior and chart activity
Sign Up to receive Walsh Trading’s 1st Half of 2026 Market Outlook First Half of 2026 Outlook for the Livestock and Grain markets.
Thursday, January 15, 2026
Corn broke out of a 3-month trading range this week on surprising USDA data...now what?
March Corn (Daily)
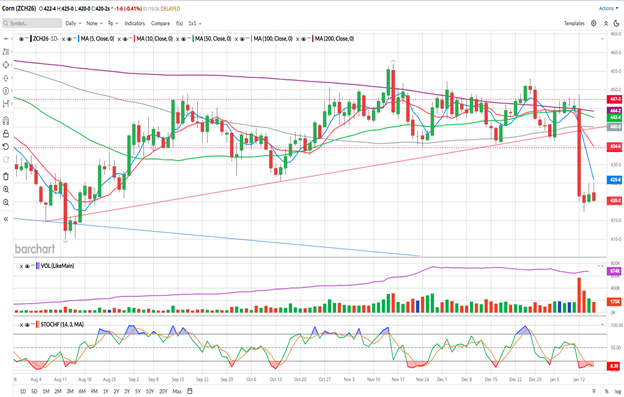
Today, March Corn settled at 4.20 ¼, dropping another 1 ¾ from Wednesday’s close. Today’s high at 4.25 matched yesterday’s, which some folks might call a tweezer or a double top. I would normally look for that type of formation at the top of a trend move, but it is worth mentioning, I think.
Following Monday’s very bearish report (surprise!! The USDA found acres that they didn’t know existed earlier in the crop year) market participants have been struggling to get a reasonable explanation. I’m not writing a justification here, but there are many analysts that have posted theirs this week, you can find them around the internet if you feel the need to look. We all knew it was going to be a record crop, but no one was looking for the crop to get to 17 billion bushels. I think the better question is “ok, what now?”
Technically speaking, the daily chart looks very weak. We didn’t even get a bounce on “Turnaround Tuesday” this week. The moves to 4.25, yesterday and today, appeared to get hit with a bit of selling pressure, as the long wicks in those price bars indicate. Those highs failed to get price back to the October lows (4.25 ½) before mor selling pressure took over. The market is trading below all of the moving averages on the chart, with the 5-day (blue) being closest at 4.25 ¾, and the 10-day (red) at 4.34 ¾. Both of those averages made a bearish crossover on Monday and are pointing toward more weakness, I think. The longer-term averages on the chart, the 100-day (grey), the 50-day (green) and the 200-day (purple) are all way higher and also pointing toward lower prices, or declining. Trade volume was extremely high on Monday but the Open Interest has ticked up a bit (purple line in the first sub-graph) which indicates new short positions and more selling pressure to me. Stochastics (bottom sub-graph) dropped into oversold territory on Monday, as well. There are two red horizontal dotted lines on the chart, which I had drawn to illustrate the trading range that the market has been content to chop around in for the past 3 months or so. Prices have definitely broken out of that trading range and may likely continue lower. The solid red trendline that’s on the chart has also been broken. Trade and trend momentum appears to be in favor of the bears.
On the daily chart, I see no significant or obvious places of support that are close. 4.20 might be round number support, or perhaps this week’s low at 4.17 ¼ may act as some support, but it appears to me that new contract lows are in play. 4.10 was the low posted on August 12th and 4.00 may be the next big, fat, round number target ahead. I would expect more margin liquidation in the coming days, unless there is a significant and immediate reaction to the upside.
Producers with unsold bushels in the bin may do well to consider Put Options in Corn. Last week, in this space, I advocated for 4.35 March or February Puts. If you chose to put those options on, you should be sitting pretty good right now. It may be a good idea to take profit on those, but I would still recommend having downside protection. If you chose my futures recommendation (for aggressive and well-margined traders) you should have been stopped out with about a 6-cent loss, before your commissions/fees. Both the entry and exit in the futures should have been triggered on Monday.
Moving forward, producers with unsold and unprotected bushels may do well to consider March Put options. They have 36 days until expiration. The 410 strike closed at 2 7/8 today, or $143.75 per option, before your commissions/fees. I think those should give decent protection against the downside, although you’ll need to mind the delta and make sure you size your position accordingly. Today, that delta is 0.32, so you’ll need at least 3 to adequately cover 5,000 bushels.
March Corn (Weekly)
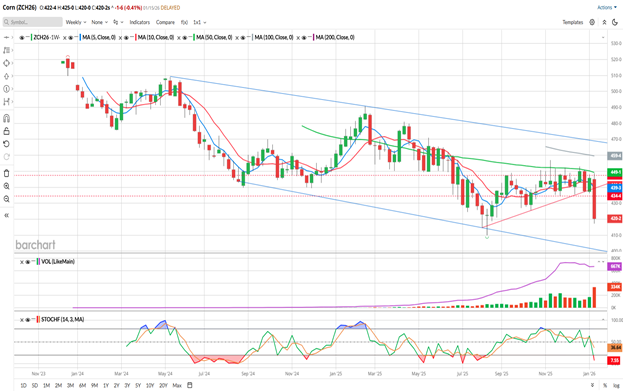
I know that we still have tomorrow, but so far for the week, March Corn is down 25 ½ cents from Last Friday’s settlement. If there’s no rally tomorrow, this would mark a new weekly contract low close. The previous weekly low close was in the middle of August at 4.22 ½, so it wouldn’t take much of a rally to close above that tomorrow. However, by looking at the chart above, it would seem to me that almost everyone that bought long positions since then is now underwater and may still run for the exits.
To my eye, the weekly view indicates a bearish trend, and I see no sign of that stopping now. Stochastics have just barely ticked into oversold on ½ the indicator, and it may take another week or two to get fully oversold.
The blue trendlines on the weekly chart are the ones I’d bring to your attention. Currently, the lower trendline is near the 4.00-4.01 level. If we hit that, it would be a new contract low. If the 4.00 mark doesn’t hold, Corn prices will have a chance to head toward the 3.75 mark.
You can find Barchart’s seasonal data for March Corn here Seasonally, Corn tends to rally in the first few months of the year, but recent price activity has taken it way out of the seasonal patterns, much like Soybeans have done over the past two months or so.
Sign Up to receive Walsh Trading’s 1st Half of 2026 Market Outlook First Half of 2026 Outlook for the Livestock and Grain markets.
If you like what you’ve read here and would like to see more like this from Walsh Trading, please Click here and sign up for our daily futures market email.
Jefferson Fosse Walsh Trading
Direct 312 957 8248 Toll Free 800 556 9411
jfosse@walshtrading.com www.walshtrading.com
Walsh Trading, Inc. is registered as a Guaranteed Introducing Broker with the Commodity Futures Trading Commission and an NFA Member.
Futures and options trading involves substantial risk and is not suitable for all investors. Therefore, individuals should carefully consider their financial condition in deciding whether to trade. Option traders should be aware that the exercise of a long option will result in a futures position. The valuation of futures and options may fluctuate, and as a result, clients may lose more than their original investment. The information contained on this site is the opinion of the writer or was obtained from sources cited within the commentary. The impact on market prices due to seasonal or market cycles and current news events may already be reflected in market prices. PAST PERFORMANCE IS NOT NECESSARILY INDICATIVE OF FUTURE RESULTS. All information, communications, publications, and reports, including this specific material, used and distributed by Walsh Trading, Inc. (“WTI”) shall be construed as a solicitation for entering into a derivatives transaction. WTI does not distribute research reports, employ research analysts, or maintain a research department as defined in CFTC Regulation 1.71.


/Nvidia%20logo%20and%20sign%20on%20headquarters%20by%20Michael%20Vi%20via%20Shutterstock.jpg)
/Intel%20Corp_%20Santa%20Clara%20campus-by%20jejim%20via%20Shutterstock.jpg)
