Grains
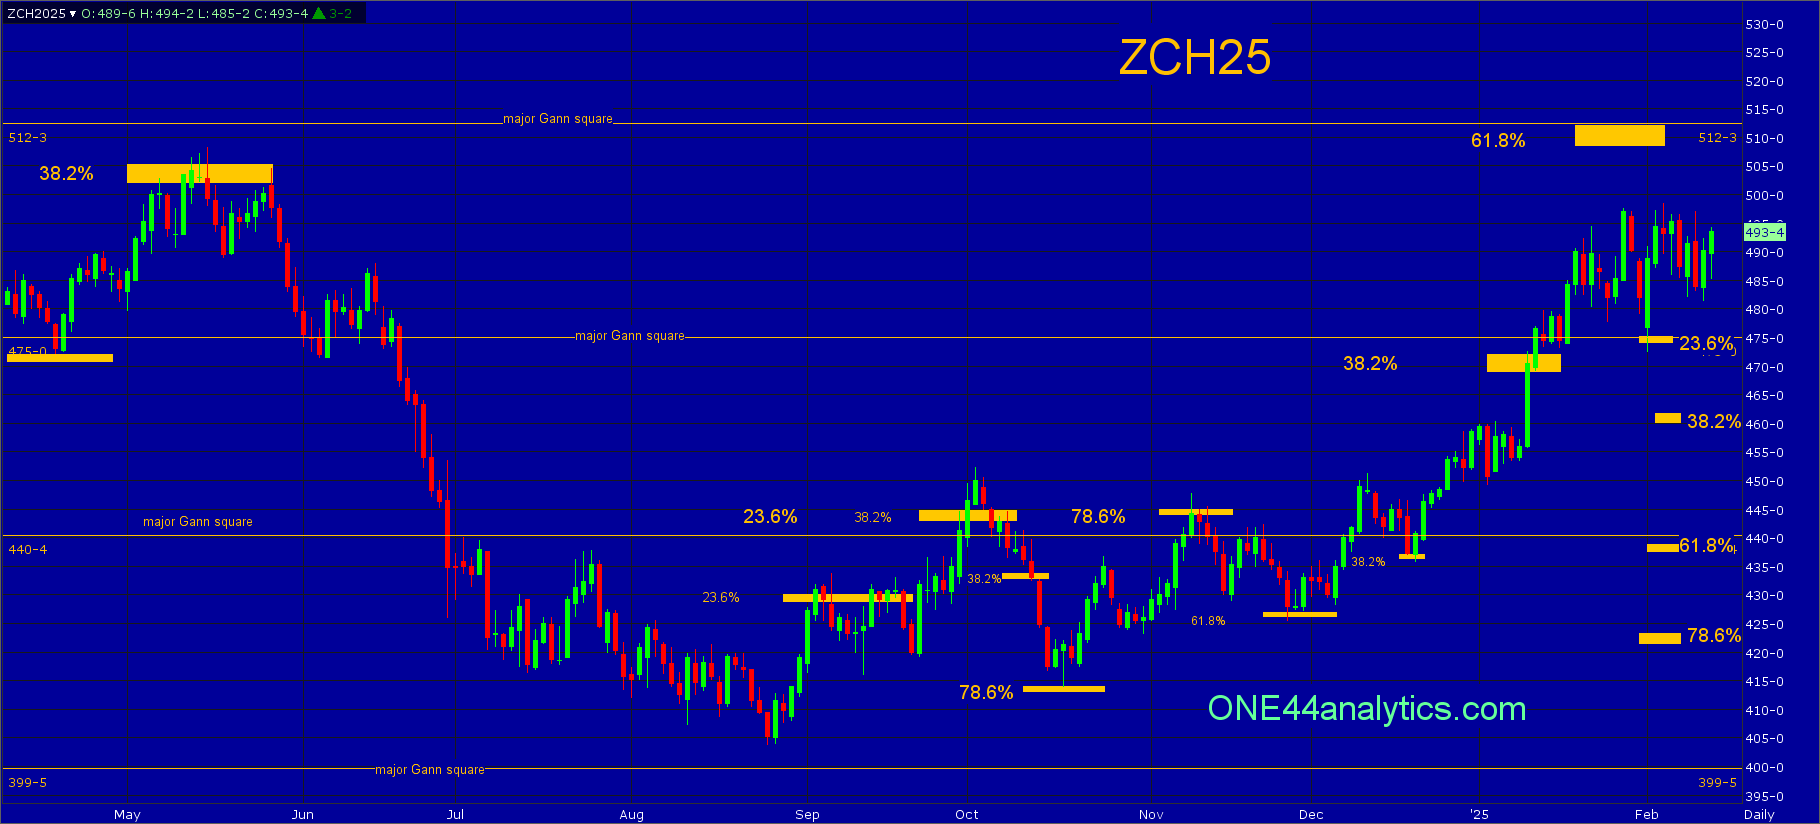
The chart below is key to this analysis.
Corn is still the strongest of the grains right now. The last setback on 2/3/25 held a 23.6% retracement and per the ONE44 23.6% guideline, Extremely strong/weak markets will only go back 23.6%. This is Typically a runaway market.
We watch all the retracements on every move to see just how strong, or weak the market is regardless of the longer term target.
Our current target area above is 61.8% at 509.00 and the 512.25 major Gann square.
Below is our analysis for the next week, you can also see on the chart just how many times the market has turned on a Fibonacci retracement.
2/13/25
March
From last week,
The spike down on Monday held the 475.00 major Gann square and 23.6% retracement keeping the trend extremely positive. We continue to look for the area of 508.00/512.25. With a slightly higher high the 23.6% level moves up to 475.75, however we are going to keep the same swing point 475.00 because of the major Gann square. The Above/Below remain the same.
Use 475.00 as the swing point for the week again.
Corn remains in a very strong position above the tightest 23.6% retracement at 475.00. Without making a new high, or low all the levels from last week remain the same.
Use 475.00 as the swing point for the week again.
Above it, the short term target area is 61.8% back to the contract high at 508.00 and the 512.25 major Gann square. Keep in mind a setback from a 61.8% level can send this market 61.8% the other way per the ONE44 61.8% rule, this level is yet to be determined. The long term target area is…
Below it, the short term target is 38.2% back to the 8/26/24 low at 461.50, this is the long term swing point now, holding this area can send it back to a new high. The longer term target is the area of ….
Our latest Fibonacci video goes over How each of the Grains made their bottom
ONE44 Analytics where the analysis is concise and to the point
Our goal is to not only give you actionable information, but to help you understand why we think this is happening based on pure price analysis with Fibonacci retracements, that we believe are the underlying structure of all markets and Gann squares.
If you like this type of analysis and trade the Grain/Livestock futures you can become a Premium Member.
You can also follow us on YouTube for more examples of how to use the Fibonacci retracements with the ONE44 rules and guidelines.
Sign up for our Free newsletter here.
FULL RISK DISCLOSURE: Futures trading contains substantial risk and is not for every investor. An investor could potentially lose all or more than the initial investment. Commission Rule 4.41(b)(1)(I) hypothetical or simulated performance results have certain inherent limitations. Unlike an actual performance record, simulated results do not represent actual trading. Also, since the trades have not actually been executed, the results may have under- or over-compensated for the impact, if any, of certain market factors, such as lack of liquidity. Simulated trading programs in general are also subject to the fact that they are designed with the benefit of hindsight. No representation is being made that any account will or is likely to achieve profits or losses similar to those shown. Past performance is not necessarily indicative of future results.
/Unitedhealth%20Group%20Inc%20%20phone%20and%20site-by%20T_Schneider%20via%20Shutterstock.jpg)

/Alphabet%20Inc_%20and%20Google%20logos%20seen%20displayed%20on%20a%20smartphone%20by%20IgorGolovniov%20via%20Shutterstock.jpg)