From War Premiums to Rate Premiums: What Is Driving Gold Right Now
Gold's recent price action has been shaped by a paradox that is important to understand. The outbreak of the US-Iran conflict in late February 2026, which initially drove gold toward all-time highs above $5,600, has since flipped into a structural headwind for the metal. The US Dollar has emerged as the primary safe-haven beneficiary of the ongoing Middle East tensions, with the USD rallying sharply as oil prices surged and inflation expectations ratcheted higher, compressing gold's appeal as a competing store of value.
The macro development that has most directly pressured gold in the past month is the dramatic repricing of Federal Reserve policy expectations. TD Securities strategist Bart Melek noted that higher inflation expectations linked to the energy shock have pushed yields across the curve higher and prompted markets to begin pricing in a Fed rate hike in late 2026, a stance that has kept the US Dollar firm and capped gold. This represents a stark reversal from pre-conflict expectations of two rate cuts in 2026. On June 6, the May Nonfarm Payrolls report came in at roughly twice the consensus forecast of 85,000 jobs, sending US 10-year Treasury yields to a two-week high above 4.50% and erasing what remained of gold's year-to-date gains. The market's sensitivity to Fed policy expectations and USD strength is now the dominant near-term driver, eclipsing the safe-haven demand that propelled gold earlier in the year.
Adding to the complexity, stalled US-Iran ceasefire negotiations continue to inject volatility. Trump demanded Iran abandon its nuclear program and fully restore navigation through the Strait of Hormuz as preconditions for any deal, while Iran's navy fired warning shots at US warships in the Gulf of Oman on June 6. Iran-backed Hezbollah also continued attacks on Israeli positions despite an agreed truce. Progress on a peace deal would likely accelerate a relief rally in risk assets and the US Dollar, which in the near term represents a dual headwind for gold. Meanwhile, UBS analysts Dominic Schnider and Wayne Gordon cut their year-end 2026 gold forecast from $5,900 to $5,500 per ounce in late May, noting that both ETF and futures demand has softened meaningfully and that markets are "rediscovering the concept of opportunity cost" as gold's non-yielding characteristics weigh in a high real-rate environment.
What the Market Has Done
- Since the capitulation selloff in late January, sellers have continued stepping down offers within the wider range bounded by 4900, which aligns with Daily Level 2, and 4300, which aligns with Daily Level 3.
- During the first half of April, sellers successfully defended 4900. This level was particularly significant as it coincided with the projected yearly VWAP and Daily Level 2 resistance.
- Gold subsequently failed to sustain upside momentum and rotated lower as market participants increasingly priced in a higher for longer interest rate environment.
- More recently, the market has compressed toward 4300 as volatility contracted and directional conviction weakened.
- Sellers have recently stepped down offers to 4600, establishing it as a near term resistance zone.
- The overall technical structure continues to reflect a market in balance, with neither buyers nor sellers demonstrating sufficient conviction to force a sustained breakout from the broader range.
What to Expect in the Coming Weeks
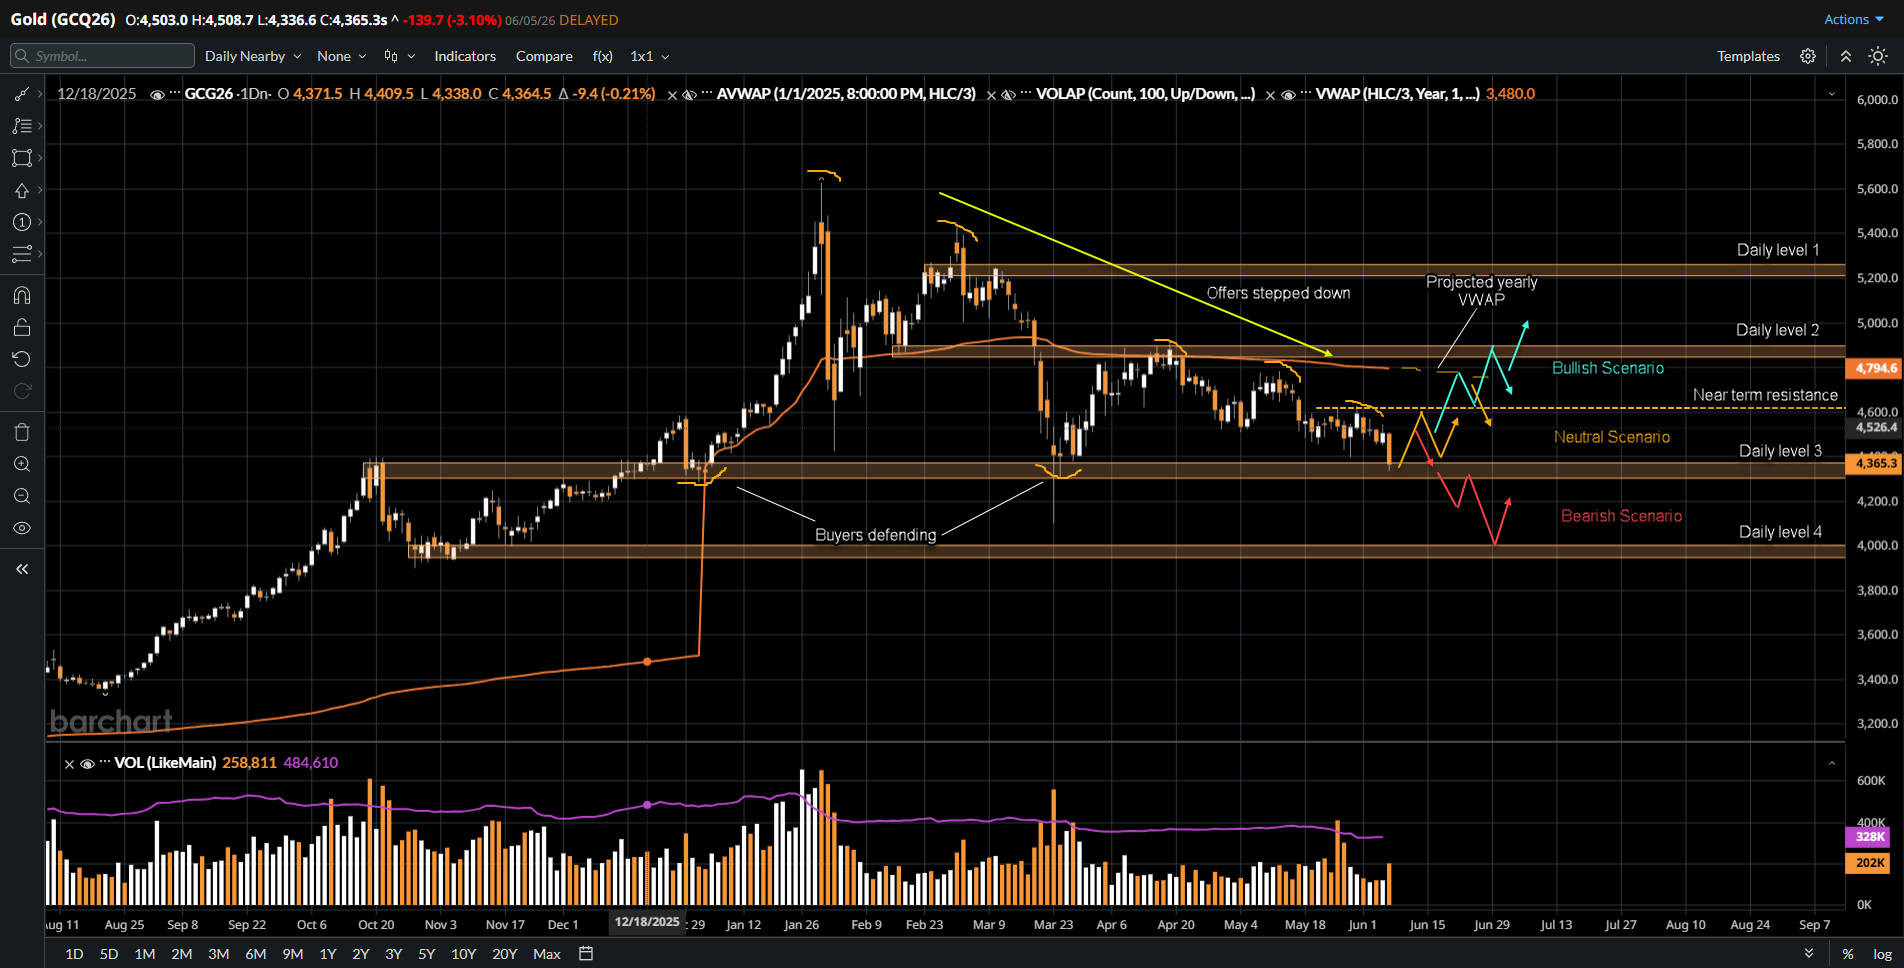
The key level to watch is $4,300 (Daily Level 3). How the market responds at this inflection point will set the tone for the weeks ahead.
Neutral Scenario
- Expect continued two way balance between 4600 near term resistance and 4300 as sellers continue compressing downward while buyers defend support.
- A possible macro trigger for this scenario would be stalled but non-escalating US-Iran ceasefire negotiations, with the Fed holding rates steady at its June meeting under new Chair Kevin Warsh while data remains ambiguous, keeping yields range-bound and gold in a holding pattern as both bulls and bears wait for clearer directional cues.
Bearish Scenario
- If sellers continue to step down offers on the rotation back up and buyers fail to hold $4,300, expect a break below and a move down toward $4,000 (Daily Level 4).
- A possible macro trigger here would be the May NFP shock proving to be the start of a sustained strong labour market narrative, with Warsh's first FOMC meeting in mid-June explicitly opening the door to rate hikes. Combined with a US-Iran deal that removes the geopolitical risk premium and sends oil prices lower alongside a Dollar surge, gold would lose both its safe-haven bid and its inflation hedge argument simultaneously, accelerating the breakdown.
Bullish Scenario
- If buyers are able to reclaim back above $4,600 (near-term resistance), expect some short covering and a move back up toward $4,900 (Daily Level 2). Sellers should be expected to offer resistance at the projected yearly VWAP, which remains confluent with that level.
- A possible macro trigger for this scenario would be a credible US-Iran ceasefire deal that temporarily reduces oil prices and inflation fears, prompting markets to push back rate hike expectations. Alternatively, a deterioration in the labour market or a significant miss in upcoming inflation data that forces the Fed back into an easing posture would revive ETF inflows and speculative long positioning, providing the fuel needed for short covering to propel gold back through $4,600.
Conclusion
Gold sits at a genuine crossroads, with the $4,300 Daily Level 3 functioning as the key pivot between two very different outcomes. The macro regime has shifted materially since the early-year highs; the Middle East conflict, rather than being a clean tailwind for gold, has created a stagflationary environment where the US Dollar is winning the safe-haven competition while rising real yields erode the investment case for a non-yielding asset. Structurally, the long-term bull thesis rooted in central bank accumulation and de-dollarization remains intact, but in the near term gold is trading the rate cycle and geopolitical headlines. The next few weeks will tell us whether $4,300 is a floor that attracts dip buyers or a ledge that gives way to a deeper move toward $4,000. How are you positioned for whichever outcome arrives first?
We built EdgeClear for traders who treat trading as a business. That means low commissions, zero-friction order routing, and free access to EdgeClear Insights—a cloud-based analytics platform that tracks your P&L, discipline, and execution quality in real time. Build your trading business on a foundation that scales with you. Open an Account today.
Disclaimer:
This article is provided for informational and educational purposes only and does not constitute financial, investment, or trading advice. The analysis presented reflects the author’s market observations and opinions at the time of writing and is not a recommendation to buy or sell any futures contract, security, or financial instrument. Futures trading involves significant risk and is not suitable for all market participants. Losses may exceed initial margin deposits, and market conditions can change rapidly.
Any scenarios, levels, or market expectations discussed are hypothetical in nature and are intended solely to illustrate potential market behavior. They do not represent actual trading results and should not be interpreted as guarantees of future performance. Past performance, market behavior, or historical price action are not indicative of future outcomes.
Readers are solely responsible for their own trading decisions and risk management. Always conduct independent research, consider your financial situation and risk tolerance, and consult with a qualified financial professional, if necessary, before engaging in futures or derivatives trading.