- DexCom (DXCM) shares have put together an encouraging short-term bounce as the company maps out a multi-year growth algorithm.
- The stock currently carries a 8% “Sell” rating, but that’s up from the prior day’s 96% “Sell” rating and 100% “Sell” last week. A positive trend on that indicator.
- DXCM is building near-term upside strength, following its 2026 Investor Day strategy presentation last week.
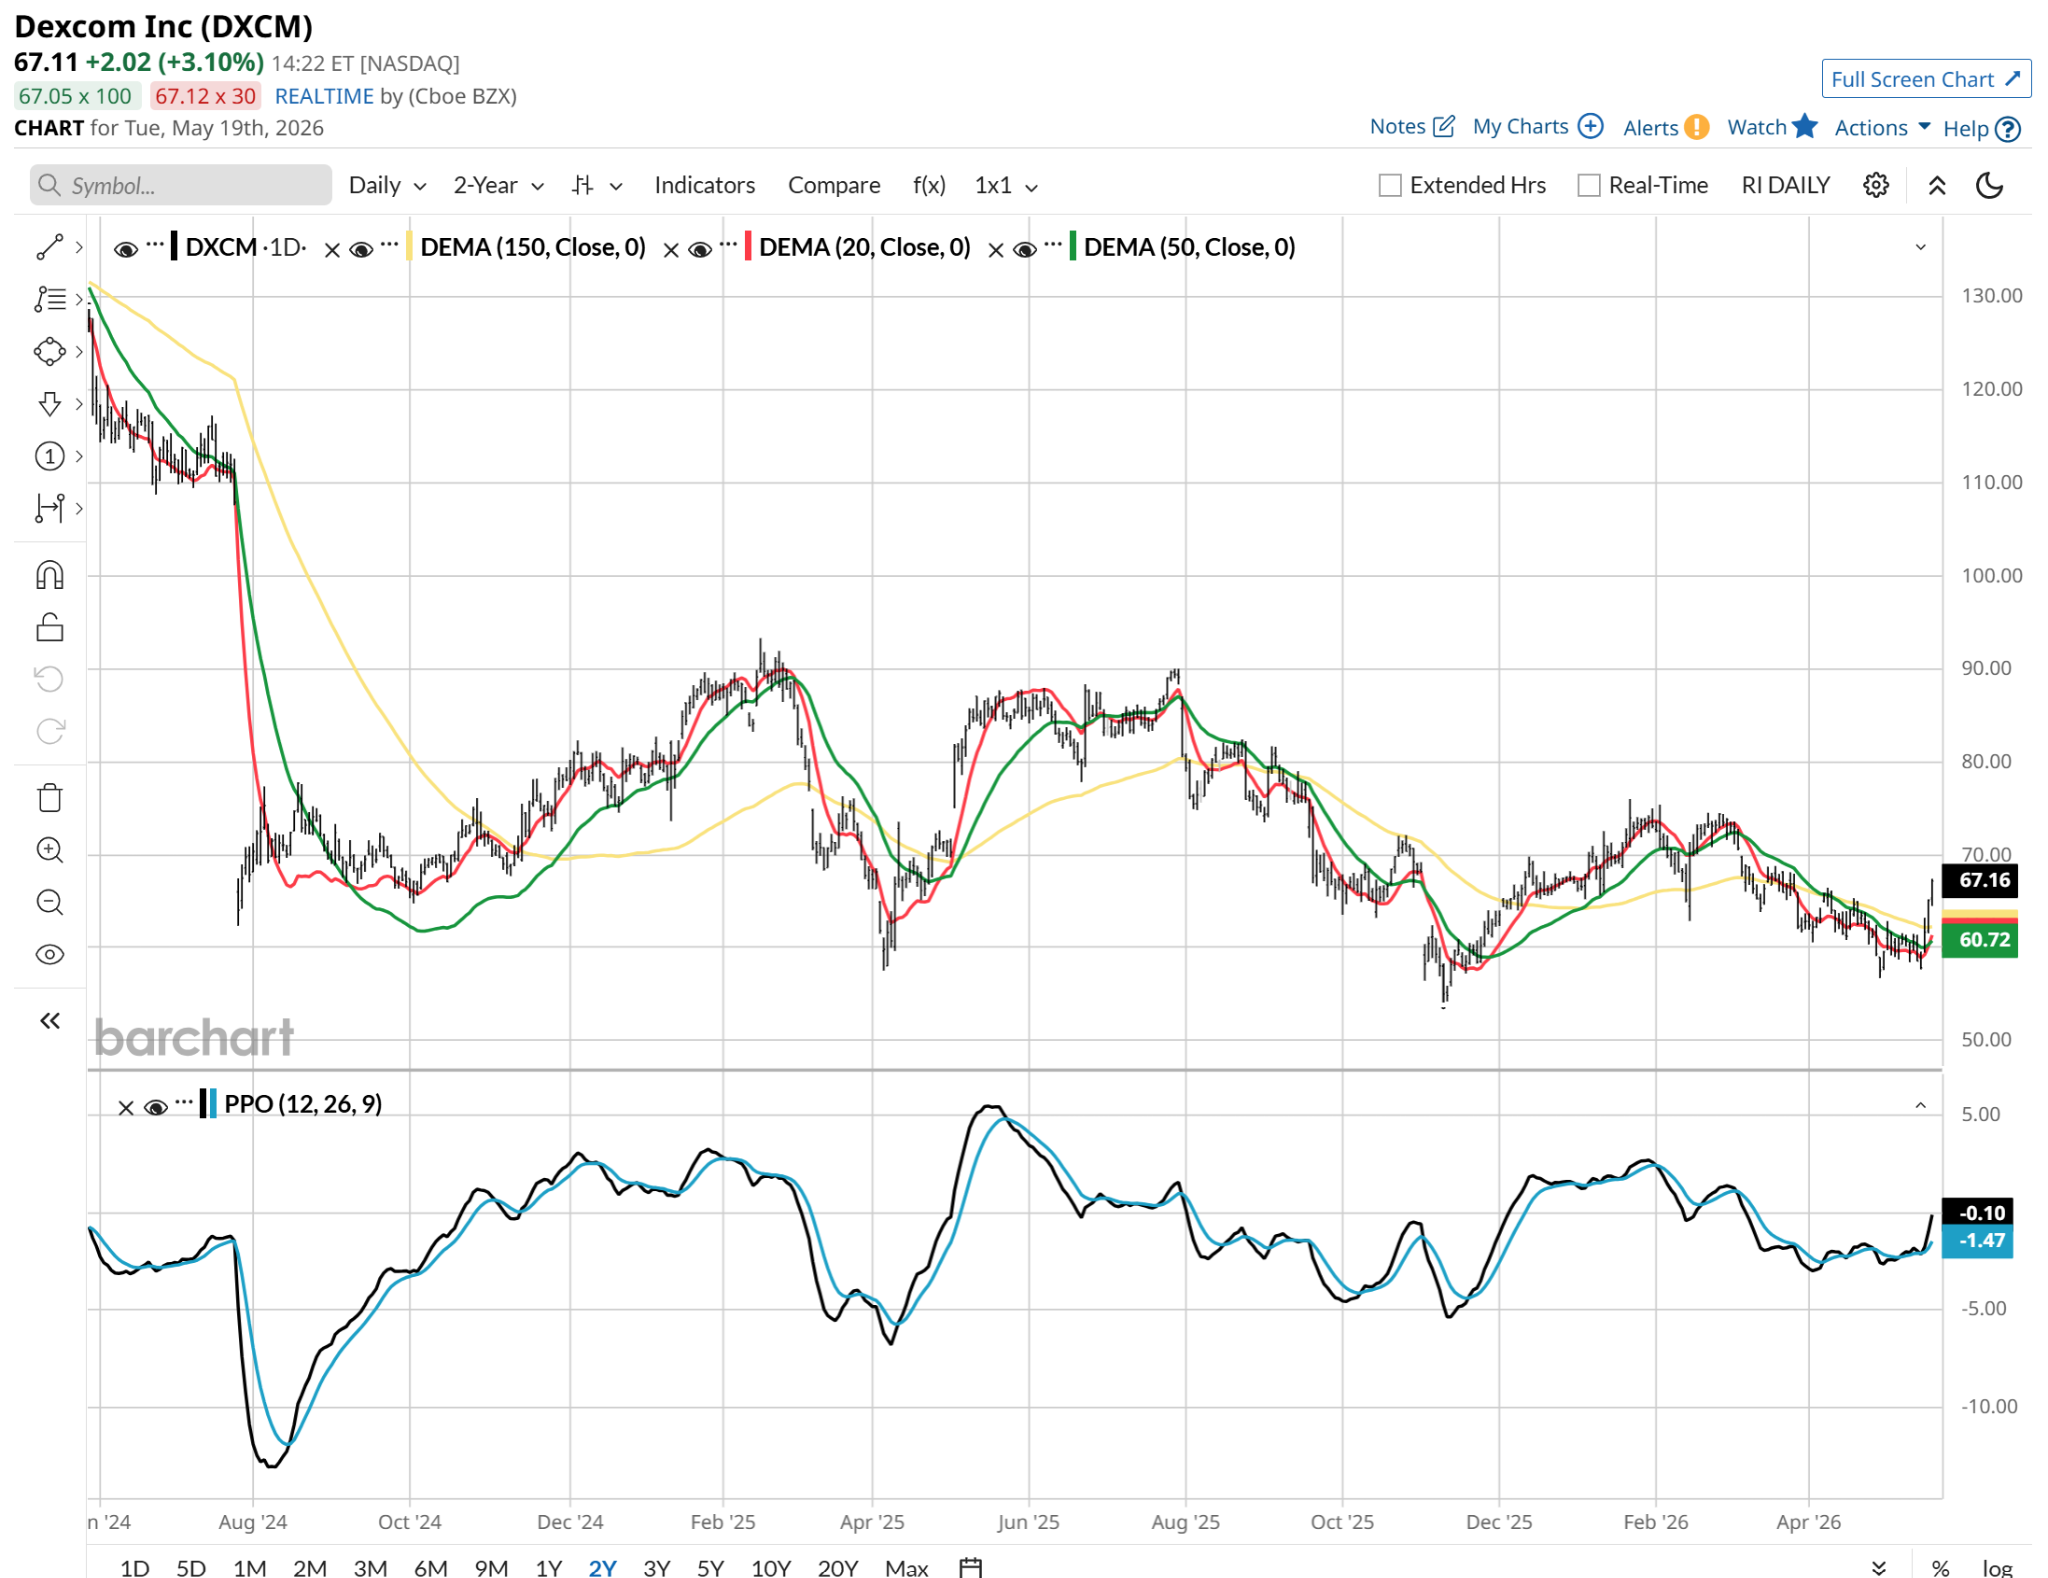
- Despite a steep winter drawdown that left the stock more than 50% below its 2024 high, and about 60% below its 2021 all-time high, a constructive base is forming well above its $56 multi-year low.
Today’s Featured Stock
Valued at $25 billion, DexCom (DXCM) is a medical device giant and the global leader in continuous glucose monitoring (CGM) biosensing technology. The company is aggressively expanding its commercial coverage to include type 2 non-insulin diabetes patients and expanding its international reimbursement footprint.
What I’m Watching
I found today’s Chart of the Day by using Barchart’s powerful screening functions to sort for stocks with notably improving technicals, a combination of momentum, strength, and direction. I then used Barchart’s Flipcharts feature to review the charts for timely opportunities. DXCM checks those boxes.
DXCM has rallied from its recent low around $56 from late April. Its 20-day moving average has turned upward for the first time in months, and its PPO indicator is on the verge of turning positive for the first time since mid-February. After a post-earnings flush that overshot to the downside, and some short-covering more recently, DXCM stock might be ready to move higher independent of those specific events.
Barchart Technical Indicators for DexCom
Editor’s Note: The technical indicators below are updated live during the session every 20 minutes and can therefore change each day as the market fluctuates. The indicator numbers shown below therefore may not match what you see live on the Barchart.com website when you read this report.
- 8% “Sell” Barchart Opinion: The macro signal remains a “Sell” due to long-term moving average crossovers, but the short-term direction is weakening the bear case.
- Trend Seeker Status: The 50-day moving average created a “Buy” signal, its first in more than 3 months, on May 18. That indicator has produced 58 trades over the past 5 years, with a total profit of 132%, and an average trade length of 31 days. That’s a powerful history.
- In addition, multiple Barchart Trading Strategies exited short positions in DXCM in the past few days, indicating a change in sentiment.
- The next logical upside target is around $74, which is a strong 10% higher than DXCM’s price late Tuesday.
Don’t Forget the Fundamentals
- $25 billion market capitalization.
- 26x trailing price-earnings ratio.
- 1.06x price/earnings-growth (PEG) ratio, showing highly reasonable valuation relative to its forward growth profile.
- 0.42x debt-equity ratio, indicating a healthy forward financial condition as interest rates continue to move higher.
- 1.4x beta, indicating DXCM stock is 40% more volatile than the S&P 500 Index. That’s a disadvantage in down markets, but with the stock showing signs of turning around, it has the opposite, potentially very positive, effect.
Analyst and Investor Sentiment on DexCom
- Wall Street Analysts: A consensus of 27 analysts surveyed by Barchart rate DXCM a “Strong Buy,” with 23 of those maintaining a “Buy” recommendation.
- Price Targets: 12-month targets range from a conservative low of $64 to a high of $112, pushing the average consensus target to $82.75.
The Bottom Line on DexCom
DexCom is currently carving out a highly constructive technical reversal, leveraging its better-than-expected Q1 results and expanded insurance pipeline to lure back growth managers. The stock’s reclaim of its immediate moving averages indicates the heavy post-earnings selling pressure has officially been exhausted.
While “Sell” opinion requires near-term caution, the stock’s discounted entry point and low PEG ratio near 1x suggest a highly favorable risk-to-reward setup.
Additional disclosure: The Barchart Chart of the Day highlights stocks that are experiencing exceptional current price appreciation. They are not intended to be buy recommendations as these stocks are extremely volatile and speculative. Should you decide to add one of these stocks to your investment portfolio it is highly suggested you follow a predetermined diversification and moving stop loss discipline that is consistent with your personal investment risk tolerance.
On the date of publication, Jim Van Meerten did not have (either directly or indirectly) positions in any of the securities mentioned in this article. All information and data in this article is solely for informational purposes. For more information please view the Barchart Disclosure Policy here.
/Microsoft%20headquarters%20By%20Peter.jpeg)
/Micron%20Technology%20Inc_%20logo%20on%20building-by%20vzphotos%20vis%20iStock.jpg)
/NVIDIA%20Corp%20logo%20outside%20building-by%20BING-JHEN_HONG%20via%20iStock.jpg)
/Amazon%20-%20Image%20by%20bluestork%20via%20Shutterstock.jpg)
/Robot%20arm%20industrial%20automation%20manufacturing%20by%20Eakrin%20via%20Adobe%20Stock.jpeg)